Let’s recapitulate: The “Define” step
Post no. 3 – In my last post I talked about the “Define” step. I showed you how to lay the foundation for a successful data analysis project. You estimated the potential benefits, formulated the goal and structured your project. Ideally, after describing the process in detail, together with all known and assumed dependencies, you were able to develop a goal statement. This defines the functional relationship between the disturbance variables and the manipulated variables on the one hand and the target variables on the other. In today’s post I’d like to move on to the “Measure” step, in which you collect the data.
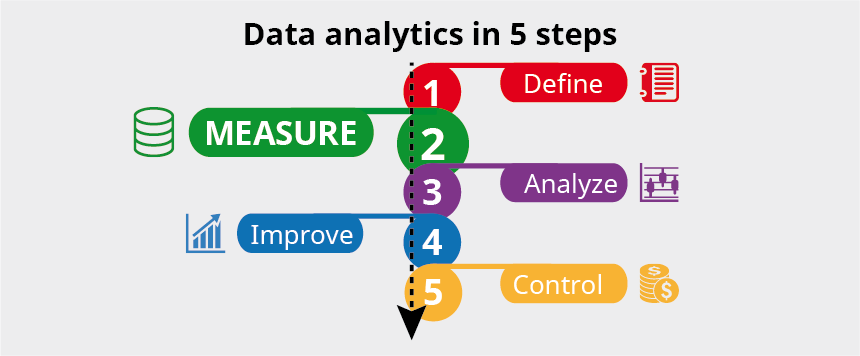
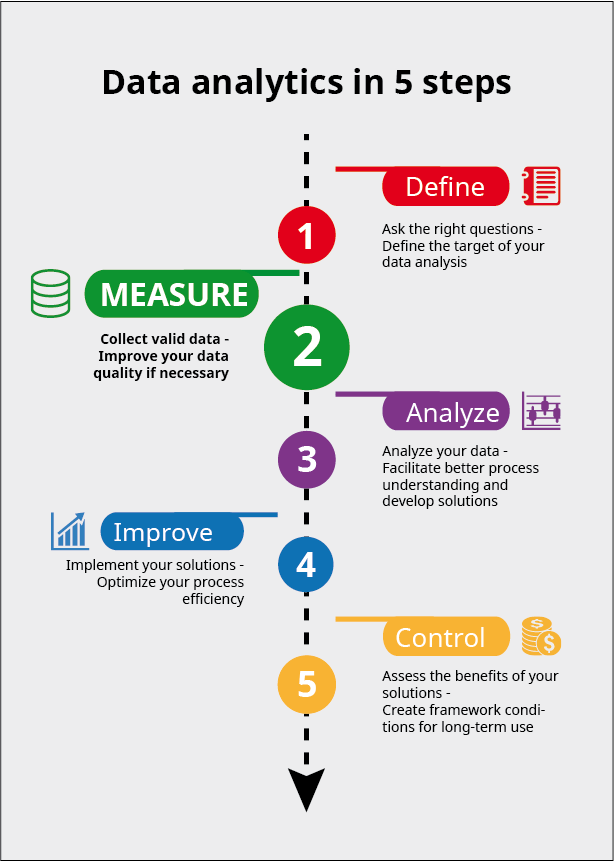
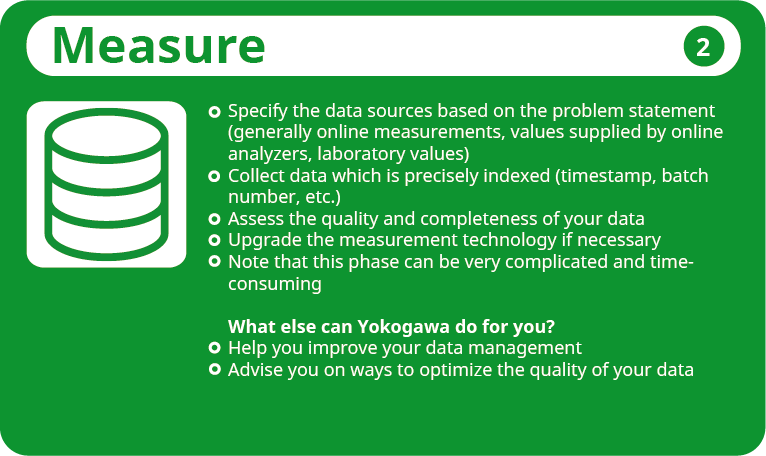
The next step: The “Measure” step
This step is highly relevant for the success of the Analyze step (step 3): your data must be of a sufficiently high quality and you must have recorded all important parameters. The “Measure” step is also of interest if you are seeking to improve your data quality without necessarily carrying out a data analysis.
The starting point
Contact with the plant owner is vital when acquiring data. Especially when you first set out, you should gather as much information as possible about field experience, to help you choose the most suitable measurement points and divide them into disturbance variables, manipulated variables and target variables. If you were unable to answer all questions adequately during the “Define” step, you should do so now.
The data you select depends on your goals. Is the ability to predict the process behavior online, in other words to optimize the process with the aim of cutting costs and improving reliability, your prime motivation or do you want to use the analysis to evaluate the correlations between individual KPIs in your process? This question has a crucial influence on your choice of parameters and on the subsequent preprocessing of the data. You should resort to online data as far as possible for process optimizations. Online data tends to be more widely available and it is also cheaper to collect. On the other hand, if you want to evaluate possible correlations, exploiting data from laboratory analyses will also be of interest. This has an impact on the preprocessing and analysis of the data in that the number of available data is reduced significantly.
Ask specific questions
Once again, I’d like to share a few basic questions with you and shed a little light on the background:
Where is your data stored?
Most modern plants are equipped with extensive measurement technology, so that large amounts of data are available. However, this data is often distributed across several different systems, so that collecting and combining is more difficult; you can also face serious problems when it comes to assigning it. And since the data may have already been preprocessed in these systems, for instance if it has been averaged, a lower information density is possible.
Which data exists and at what intervals is it recorded or measured in the lab?
The time interval between two data sets should be short enough to map the process dynamics. The analysis data should be recorded with a sufficiently exact timestamp to enable the online data to be assigned accurately.
Are all important data recorded often enough?
Gaps or errors in the recorded data are the biggest problem here. It could even be that you don’t record certain key performance indicators at all. In this case, you should consider upgrading your measurement technology. If so, make sure you weigh up the availability of suitable technology, the costs (and effort) for installing it and the time frame which is needed to collect a sufficient amount of data. It could also make sense to carry out the laboratory analyses more frequently over a defined time period, in order to obtain a higher information density and estimate the KPI’s dynamics more reliably.
How accurately is the data recorded?
Since the data is recorded during normal operation of the plant, factors such as suboptimal measuring points, insufficient maintenance or unavoidable external influences could impact on its accuracy. The results may also vary considerably from one sample taker to another. You should make sure here that every sample taker arrives at the same result for a particular sample or that individual sample taker supply reproducible values if the same sample is analyzed several times.
Are all measured values precisely defined and can they be accurately assigned to a particular operating state?
The assignability of laboratory analyses to online measurements is often a problem here, as the sampling time must be recorded exactly. Your measuring instruments should ideally have an automatic sampling time recording function. Online data, too, sometimes lacks a timestamp, or has a different timestamp in different systems, so that it is not feasible to assign it later. Recording different process conditions with a different influence under a single generic heading is likewise tricky. In this case, separating the information subsequently will probably be extremely complicated, if not impossible.
How dynamic is the process?
This impacts on the downstream preprocessing of the data; in particular, it affects whether averaging makes sense as well as the minimum time intervals between individual online values.
How great is the data variance?
Both extremes – parameters which remain constant over a long period and parameters with a wide range of values – can cause problems when it comes to modeling. For instance, if the variance is too small, you may not be able to use a particular KPI later to optimize your process whereas if the value range is too wide, the dynamics of the parameter will be lost in the noise.
Can the products be tracked?
A causally correct shifting of the data is essential in order to carry out a data analysis, in other words the cause and effect must be merged in one data set. With discrete processes, an accurate assignment is generally possible based on the discrete item. With continuous or batch processes, on the other hand, model assumptions are required. You should therefore record all parameters which are necessary to estimate the residence time or to determine the operating or processing times.
Which measuring instruments are used and how accurate are they?
This question provides advance information about noise in the data.
Does other documentation exist?
Production processes change constantly, for instance due to faults, switching to another product or raw material, conversions or modifications, parts which are replaced or special modes of operation. Make sure your documentation is as accurate as possible, so that it can be used later to evaluate the data.
A first look at the data
You should try to answer the above questions in as much detail as possible because the data situation is crucial for the success of your data analysis. As part of the data acquisition process, therefore, I recommend that you take a look at a typical data set over a defined period of time. A rough statistical evaluation of the minimum, maximum and mean values as well as the standard deviations will suffice to give you a good overview. It’s also worth glancing at the data distribution in the form of histograms. If you have any doubts regarding the data quality, or if extending the database would be too complicated and too expensive, you should ask yourself once again whether the project is really profitable. Since preparing the data is by far the most time-consuming part of the analysis, poor-quality data can jack up your project costs and your time schedule enormously before you even get going. The questions confronting you are mostly applicable to existing plants; however, they should also serve as a starting point when planning a (test) plant.
Let’s recapitulate
Assuming I haven’t frightened you off too much with all the pitfalls of data collection, I hope you’ll stick with me for more. My next blog post – on the “Analyze” step – will, unsurprisingly, be all about how to analyze your data. In particular, I’ll be looking into the task of data preprocessing; after all, a structured approach and thorough groundwork are important prerequisites of any successful analysis.
Did you miss a blog post?
No problem – all posts in this series can be accessed here:
– Post no. 1: “Analyze your data – Success in 5 steps”
– Previous post: “Analyze your data – Step 1: Define”
– Next post: “Analyze your data – Step 3: Analyze”
– Post no. 5: “Analyze your data – Step 4: Improve”
– Post no. 6: “Analyze your data – Step 5: Control”