Let’s recapitulate: The “Measure” step
Post no. 4 – After completing the Define step, in which we developed the goal statement for a data analysis, we took a closer look at data collection in my last post on the Measure step. I hope the list of questions I compiled gave you an insight into the data which is relevant for you and the criteria it should fulfill. It’s important that you have as many complete data sets as possible of sufficient quality and with sufficient resolution for the Analyze step which now follows. Provided you’ve gathered together all of the essential information for a causally correct shifting as well as any other important information in documents, you can now get down to actually analyzing your data at long last.
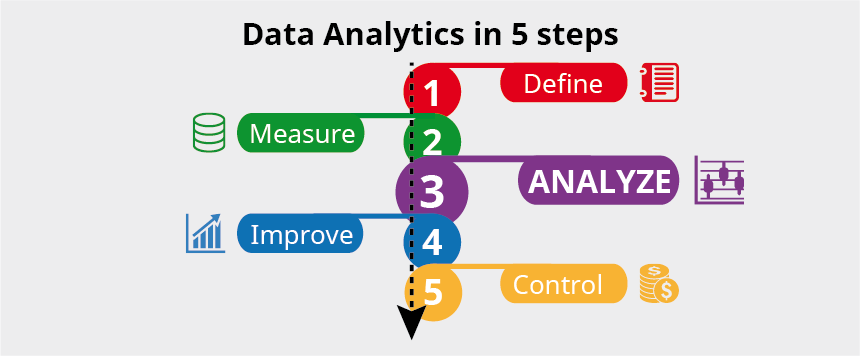
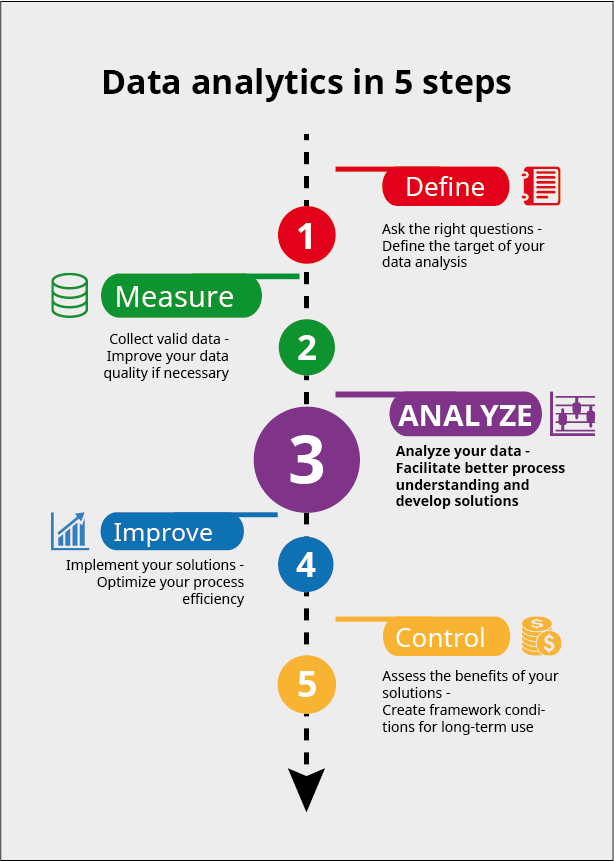
Here goes: The “Analyze” step
It’s now time to analyze your data – which is what this series of blog posts is all about.
When I first hit on the idea for this series, I didn’t have a very clear picture of the content of each individual post straight away. Now that I’m actually sitting here writing the blog, I realize just how much material is involved. Where should I start and where should I finish? If I go into as much detail as I did in my last post, you’ll probably give up reading half-way through at the latest. In any case, there are so many different methods around and everyone has their own ideas and preferences. That’s why I’ve decided merely to give you a general overview of the basic procedure, with the emphasis on data preprocessing. I believe that a structured approach to the “Analyze” step is at least as important as selecting the right analysis tool. You can also discover a lot of handy tips and methods in the VDI Status Report, which I recommend that you read if you’re interested in learning more.
Before I continue, I’d like to point out that I’ve tried to find concise and easy-to-understand links to the methods described here – enough to provide you with a quick impression. However, I haven’t checked every single item of information they contain, nor do they necessarily cover all the details of a particular method.
Step by step to your goal
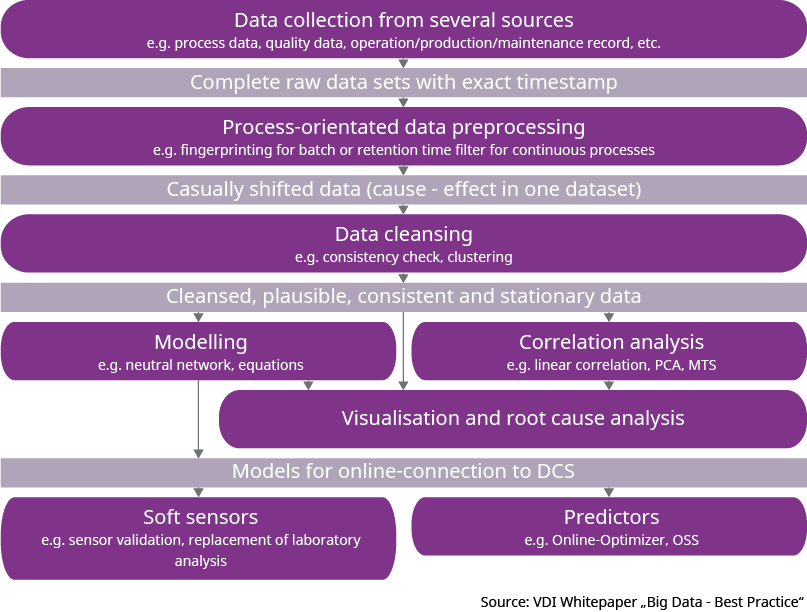
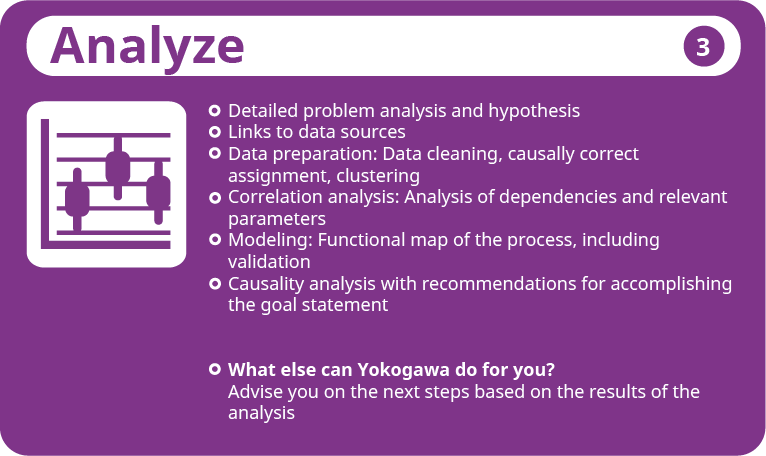
The “Analyze” step can be further broken down into several smaller steps, which I’ve summarized for you below in a simplified diagram.
The big data puzzle
Depending on your goal, you will already have gathered together the data you need for your analysis in the Measure step. Since you probably got it from different sources, you’re now confronted by the big data puzzle. Different sources, different formats – I can’t say I envy you! Sorry for being sarcastic – but let’s be honest, this step can often be enough to make you tear your hair out. It’s time to be very grateful to the person who gave some prior thought to the consistency of the data sources. Yet whatever state your input is in, you need to end up with a database where each parameter is contained in a separate column and each row is clearly assigned with a timestamp, batch number and / or item number. And, what’s more, with as few gaps as possible in the data.
Time is of the essence
You’ve now got a uniform database. You’ve also got a “problem”: each product goes through a process, so that the cause and effect are not stored in the same data set. However, this is absolutely vital for the analysis, because otherwise it’s highly likely that the correlations you’re analyzing between your parameters will be incorrect. You should therefore consider the process from the perspective of your target variable(s), in other words the impacts, and assign the input variables – the causes – to this moment in time based on product tracking. These variables won’t normally be plain measured values any more but values calculated from the time series of historical measurements.
With discrete or batch processes, you combine the individual production or process steps into so-called fingerprints. In the simplest case these will be averages, gradients or margins of deviation. The duration of each step, too, is very often a key characteristic parameter. More complex parameters which characterize the process as closely as possible can also be determined. Controlled variables, for instance, don’t initially contain any information that is useful for an analysis because they are constant. For this reason, I advise you always to calculate specific parameters that generate additional information for your, such as the weight-related energy input at a constant temperature.
With continuous processes, you should shift the individual data columns relative to one another according to the residence times in the individual process stages. Variable dead times should ideally be calculated, for example from tank volumes and flow rates. If the process is less dynamic, you can also leave just the stationary data in the database and delete the transitions.
Check your data
Before you finally start to analyze your data, you should check it for plausibility. Inconsistent data sets can result from missing parameters or from measuring or sampling errors. All non-plausible data sets must be removed from your database. However, nonconformances may also be specific to a particular process; this can usually be recognized from events which recur systematically. If this is the case, you can take these events as a starting point for analyzing the root cause.
There are various possibilities here, such as checking the balance equations or applying statistical plausibility filters. You should take a look at the data distribution in histograms or boxplots, for example, and check known correlations. A whole series of statistical outlier tests also exist for this purpose as well as statistical process control (SPC) rules. Please bear in mind that data from industrial processes only rarely conforms to a strictly normal distribution, so that statistical methods frequently come up against their limits.
Clustered together
It’s an advantage to cluster the data before you analyze it, especially if time series with constantly recurring patterns are likely. For one thing, this is a good way to reduce the influence of noise in the measurements. For another, process states which occur regularly are combined together in a pattern, so that uniform coverage is achieved throughout the data space. This is necessary when you come to model your process, so that even less frequent states can be mapped with the highest possible accuracy.
Time to start the analysis
We’ve made it at last. Not that I’m trying to frighten you, but you’ve probably used up between 70 and 80 percent of your allotted processing time by this point. I just want to give you a feel for how complicated and time-consuming data collection and preprocessing can be compared to the actual analysis.
So, the time has finally come. What happens next depends partly on your goal. For a correlation analysis, you carry out a statistical examination of the correlations which exist in the data, then derive cause and effect information which is relevant to the questions you formulated during the Define step. If you want to create a model, the aim is to determine a functional correlation between the input and output variables, to enable you to map the process. Of course, you can – and should – also analyze your models; however the main focus here is on using them subsequently online.
I myself begin a data analysis by drawing lots of little pictures in different colors. I find it helpful to start by identifying possible correlations visually, and to develop a feel for them and the process variance. You can get a good overview of your data from trends in conjunction with scatter plots or parallel coordinates, which should ideally be categorized. To me, that’s more intuitive than studying columns of data, though you could obviously also kick off with a correlation matrix, for instance.
Many different methods
As I mentioned before, there are many different methods of analysis, each of which has its specific advantages and disadvantages. Decision trees, for example, can help you derive decision rules from your data, which you can then interpret and translate into concrete instructions. However, if key operating states cannot be clearly assigned, rules can quickly become unclear or imprecise.
A lot of different things are measured in the course of the process. You can therefore assume that you won’t need every single variable in order to describe your problem. A principal component analysis (PCA) will allow you to identify those variables which map most of the variance in your multidimensional space. You can thus simplify the analysis by restricting it to the relevant influencing factors. Unfortunately, though, the resulting variables are not always easy to interpret. Furthermore, like all multivariate statistical methods, a PCA presupposes that the data is symmetrically distributed, which with industrial processes is frequently not the case.
Artificial neural networks, for instance, are far more robust here. You can also process a larger number of input variables and map any functional correlations. In other words, you obtain a model of your process in this way – and by manipulating the input variables, you can try out all kinds of things that you wouldn’t normally do in the process itself. However, to achieve a reasonable degree of accuracy, you must have a sufficient number of data sets which increases exponentially with the degrees of freedom. What’s more, the configuration is not particularly easy.
Process Data Analytics made by Yokogawa
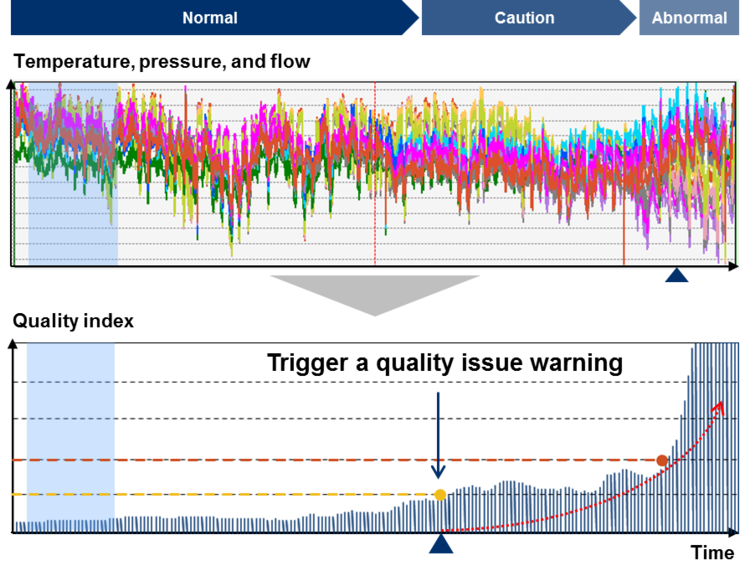
We at Yokogawa use Process Data Analytics, a software solution developed in-house which is based on the Mahalanobis-Taguchi algorithm and pattern recognition method. Abnormalities in the process can be detected by calculating the so-called Mahalanobis distance. You are also told which of the relevant parameters contributes to the Mahalanobis distance and to what extent. By combining this information with the trends, scatter plots, histograms and statistical parameters which are likewise integrated, you can identify the causes of any abnormalities, for example quality issues or process fluctuations.
For more information, please read the guest post by Xiao Wei.
Eyes and ears open while you interpret
One golden rule with any analysis is to pay due regard to in-depth process knowledge. If you don’t bring it to the table yourself, make sure you talk to the people who do! You can only interpret your results in a targeted way and develop suitable solutions by associating the most suitable analytical method with the necessary process know-how.
You should moreover be permanently aware that the statistical correlations which exist in the data are always revealed by an analysis. These correlations are purely indicative and do not constitute proof of an actual effect! If you ignore this, you could be in big trouble when you come to interpret the cause and effect in relation to manipulated variables – namely when you manipulate a manipulated variable in the process and precisely the opposite happens to what the data analysis led you to expect. Please therefore only ever manipulate independent variables carefully, gradually and with the necessary process understanding!
Let’s recapitulate
You’ve just received a brief walkthrough – brief in terms of content, that is, not text length – of the “Analyze” step. If you have any questions, observations, criticisms or suggestions – or if you’re interested in a more comprehensive account of this or any other topic covered in this series – don’t hesitate to ask! Write me a comment – I look forward to receiving your feedback.
Are you clear on what we’ve discussed so far? If so, proceed on next Wednesday, 7th February here with the Improve step. What can actually you do with the results of the analysis? There are plenty of options open to you, from process monitoring to soft sensors and online optimizers. I hope you’ll stick with me! And, as always, feel free to leave a comment!
Did you miss a blog post?
No problem – all posts in this series can be accessed here:
– Post no. 1: “Analyze your data – Success in 5 steps”
– Post no. 2: “Analyze your data – Step 1: Define”
– Previous post: “Analyze your data – Step 2: Measure”
– Next post: “Analyze your data – Step 4: Improve” available on Wednesday, 7th February
– Post no. 6: “Analyze your data – Step 5: Control”