Let’s recapitulate: The “Improve” step
In my post on the Improve step we talked about how to implement the results of the Analyze step. We need to distinguish here between “simple” measures and the use of online models. Measures like adapting or extending the control concept, for instance, can often be realized comparatively easily whereas online optimizers – the ultimate discipline – require disproportionately higher effort, unless of course you’ve found a universal solution for a particular process which only needs a few minor adaptations to take account of individual plants.
Control is everything
After successfully implementing all of the measures in your process and waiting a while, you’re probably eager to assess their impact. It’s now time to judge the effectiveness of your solution.
Reap the fruits of your work: Control
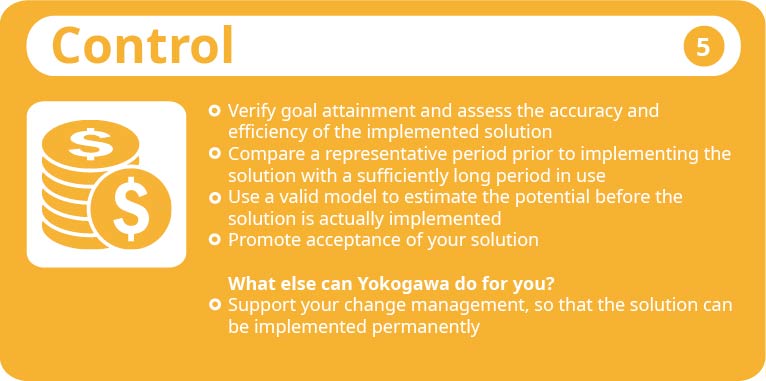
Are you longing to know what effect all your efforts so far have had on your bank balance? You certainly should be! Before we move on to that subject, though, I’m afraid I’ll have to curb your impatience for a minute. If you’ve implemented an online system, you should check continuously that it is accurate, especially during the initial period after setting it up. Make sure your solution is accepted by the people who actually use it. After all, even the best solution is worthless if everyone does their best to avoid it. Explain how the system works, define responsibilities and verify the solution’s effectiveness at regular intervals. This is vital to ensure that your data analytics in 5 steps is as successful as you intended. Especially with online optimizers, I’ve often found that the recommendations they come up with appear at first glance to go against everything the operator has ever experienced. Yet after thinking about them for a while, they turn out to be absolutely logical and correct. There are times when excellent persuasive skills will stand you in good stead.
But that’s enough digression: in the Define step you estimated the potential benefits of the data analysis. You can take the parameters you selected back then as a starting point here too. Compare a period prior to the solution – if possible, when similar circumstances prevailed – with a meaningful period after it was implemented. How has your KPI evolved? By contrasting these two periods, you should hopefully be able to gauge the success of your measures, for example as an improvement in product quality or a significant reduction in operating costs.
One step back
If you have a valid model, you can achieve even more. You can preview the likely impacts – usually cost savings – of your solution before you actually implement it. To do this, take any representative period and use your model to calculate a KPI for it. In the Measure step you divided your data into manipulated variables and disturbance variables, and you can now recalculate the KPI based on the ideal manipulated variables. You obtain these with the help of a nonlinear optimizer. Of course, you can also use the model to test the adjusted setpoints. In this case, simply specify this value for the parameter in question. By comparing the KPI for the representative period with the KPI with the ideal variables, you can determine your solution’s potential benefits upfront. At the same time, you can estimate whether or not it makes sense to use an online optimizer as described in the Improve step.
If the KPI is not the output of your model but contains output variables from the model, you should always use the model to calculate these values. There is a degree of fuzziness in every model. To prevent this from impacting on your assessment of the potential benefits, I recommend that you calculate both the original and the ideal state using the model.
Let’s recapitulate
We’ve now come to the end of this series. I hope I’ve managed to provide you with plenty of useful information and convinced you of the enormous benefits of a data analysis. Data is quite simply too important a resource to be left idle. There’s so much potential just waiting to be tapped. I’d like to recommend the VDI Status Report to you once again as further reading; it confirms many of my personal experiences and contains a lot of handy tips that are too numerous to all be included here. I’d also be very happy to support you with Yokogawa’s own project experience. Feel free to contact us!
Have you learnt something new? We certainly have!
I’m reluctant to say goodbye without a few words on the subject of “lessons learned”. A data analysis is a very complex affair involving multiple disciplines. I can hear you asking why – isn’t the right analysis tool all you need? Of course, there are specialists in this field who are able to apply just about any method under the sun. Perhaps they also know a lot about databases.
However, try putting a mathematically minded analyst together in the same room with a foreman, whose process expertise is immense. Then, as the project progresses, introduce the two of them to the IT specialist who’ll be implementing the solution once it’s fully developed. It’s likely to be a collision of worlds. Yet these worlds have to be reconciled in order to analyze and interpret the data in a targeted way to the benefit of the process, and then translate the results into viable solutions. That may sound slightly over the top but it serves to make a point, namely that data analysis demands a high degree of flexibility and an ability to communicate effectively, especially on the part of the analyst. What I’m actually getting at here is “co-innovation is the answer”! One person alone will find it virtually impossible to cover every single aspect. Your job is to bring the right people together. You’ll discover it’s a surefire way to maximize your success.
Oh, and before I forget, a data analysis only works with valid data. Make sure you have the necessary infrastructure in place! You’re no doubt thinking I’ve harped on about that far too much already! In that case, all that’s left for me to do is to thank you for your interest and invite you to join us in:
Co-innovating tomorrow!
Did you miss a blog post?
No problem – all posts in this series can be accessed here:
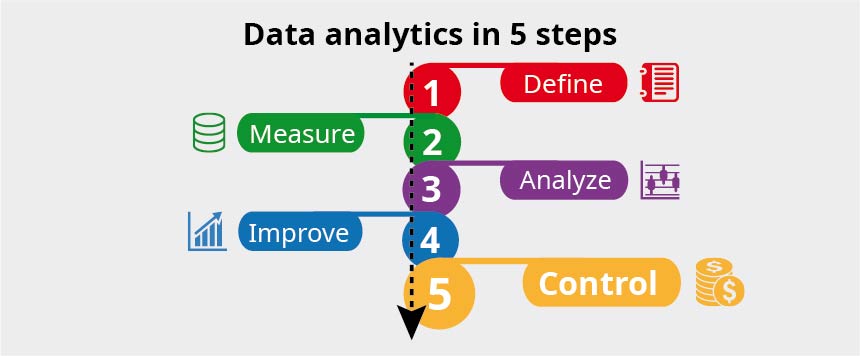
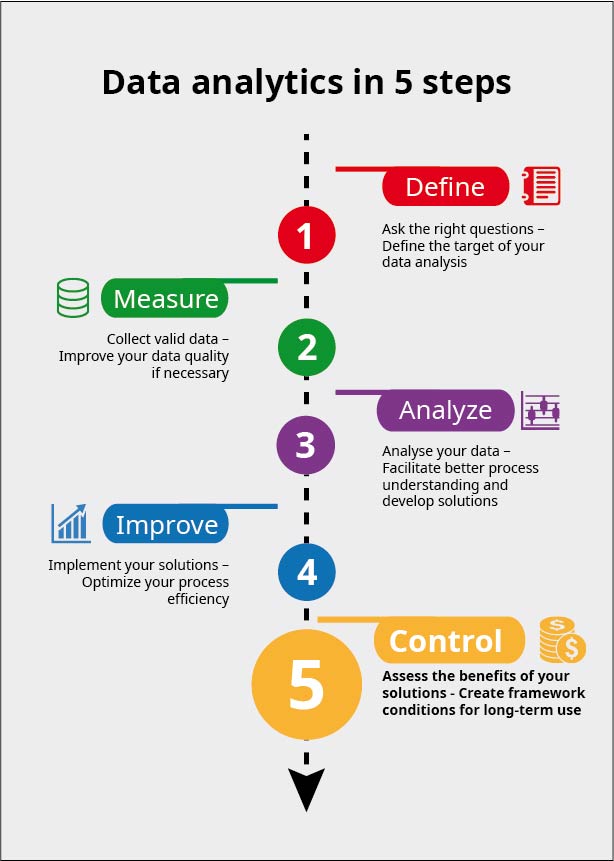
– Post no. 1: “Analyze your data – Success in 5 steps”
– Post no. 2: “Analyze your data – Step 1: Define”
– Post no. 3: “Analyze your data – Step 2: Measure”
– Post no. 4: “Analyze your data – Step 3: Analyze”
– Post no. 5: “Analyze your data – Step 4: Improve”
– Post no. 6: “Analyze your data – Step 5: Control”


Thanks for posting the interesting series. Loved the details, continuity and flow of the articles, hope to see more with this kind of coverage.