
Visualization

Hand in hand with the process data

Alarm! Is there now a hectic rush at the control station? Or does the operator lean back and relax, press a button to acknowledge the alarm and continue to sip the coffee he bought a minute ago?
Both are possible, both are interesting information – usually when it comes to alarm management for the analysis and reduction of alarms according to EEMUA 191, for example. But even at the beginning of a data analysis, a look at this data makes sense.

Hand in hand with the process data Read More »
Dynamic interlock visualization: reduce production delays, improve operations

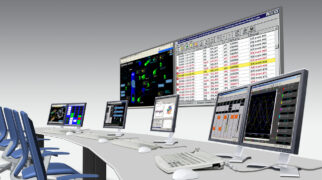
Yokogawa’s interlock monitoring solution provides an intuitive display of Dynamic Interlock Visualization that mirrors the interlock configuration on the ICCS. The interlock status signals from the ICCS can be used to update the information presented in the web user interface through an OPC DA connection. This enables tag data acquired through Exaquantum to be monitored and analyzed.

Dynamic interlock visualization: reduce production delays, improve operations Read More »

Scroll to Top