Alarm! Are things about to get hectic in the control room? Or will the operator simply sit back and relax, press the “Acknowledge” button and take another sip of the coffee he brewed himself only a minute ago?
Both of these are possible scenarios and both are interesting information – especially when it comes to alarm management as a strategy for analyzing and reducing alarms, for example according to EEMUA 191. However, it also makes sense to take a look at this data at the start of a data analysis.
Identify priorities quickly
The first step when a new data analysis project is in the pipeline will generally be to study the relevant process data. You need to get a clear overall picture of it as quickly as possible and match it up to the information you gathered during the definition phase. This is exactly what happened in a Yokogawa project with OXEA Produktion GmbH & Co. KG, where the aim, in short, was to determine what was causing vibration in a campaign process.
The initial data analysis confirmed OXEA’s assertion that a lot of experience had been built up since the first campaign back in 2015. The serious instabilities that were a problem in the early days are long gone. However, few people realized just how much experience has been accumulated at OXEA in the three years since then. The operators intervened in the reactor and the downstream column almost twice as often as in all other plants combined. This wasn’t due to excessive alarms – the content of many of these manual actions was remarkable too. Yet it was precisely this learning by doing that taught OXEA’s personnel the value of taking a closer look. Together with a targeted analysis of the process data, it provided them with vital clues for optimizing process management.
A relatively simple adjustment of the control concept was all that was required to kill two birds with one stone. A tank level control now works fully automatically and feed quantities no longer have to be regulated manually, but are integrated in an overall reactor control concept; the plant runs much more smoothly as a result – significantly easing the burden on the operator. On the other hand, considerable persuasive skills are called for whenever any such changes are made to the control concept, because people tend to be very reluctant to reassess the way they operate “their” plant.
“The clearer and the more transparent the improvement, the more likely it is to be accepted afterwards – as was the case here,” says Stefan Frentzen, plant manager in Marl.
 Form a complete picture
 Form a complete picture
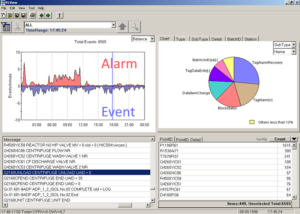
Tools that help you display and process alarm & event data in a structured way can greatly simplify your analyses. One such tool is Exaplog, which is suitable for statistical analyses of both historical and online data. The Event Balance Trend, an elegant visualization feature which shows the balance between alarms and operator actions, deserves particular attention. Patterns in the data can be instantly recognized in this way, and in the best case alarms and operator actions will be exactly balanced. Unnecessary alarms, operator overreactions and alarms attributable to operator errors are likewise visualized.
But let’s get back to the world of Exaplog. The application described here illustrates very clearly how this additional view of alarm & event data has speeded up data analyses significantly, or indeed made them possible in the first place. It is only by considering process data together with alarm & event data that we get a complete picture of plant behavior. This is sound advice for all newbies to data analytics. In keeping with the motto “It doesn’t always have to be big data,” a comparatively simple data analysis frequently suffices to deliver measurable results. So, let’s get down to work – and manage a few alarms on the way. I’m certain that you’ll find what you’re looking for without even trying.
And for all those who insist on big data: machine learning methods let you scan both alarm & event data and digital operator logs, so that you can evaluate and automate sequences or use a plant topology to predict data propagation paths within a plant based on the alarm density.
https://www.yokogawa.com/eu/blog/chemical-pharma/en/author/silke-mueller/
Design thinking – tackling digitalisation with help from your users