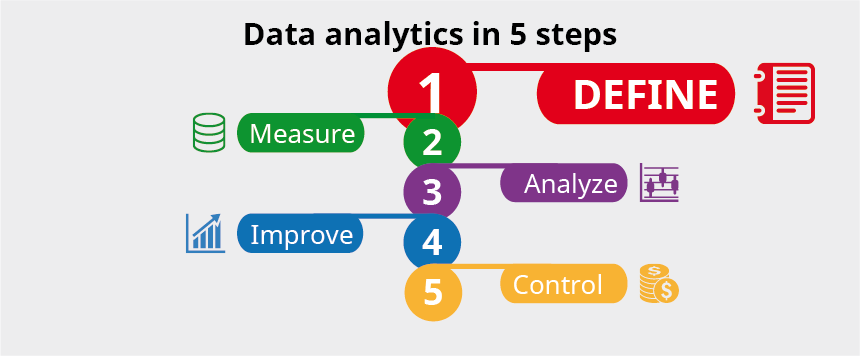
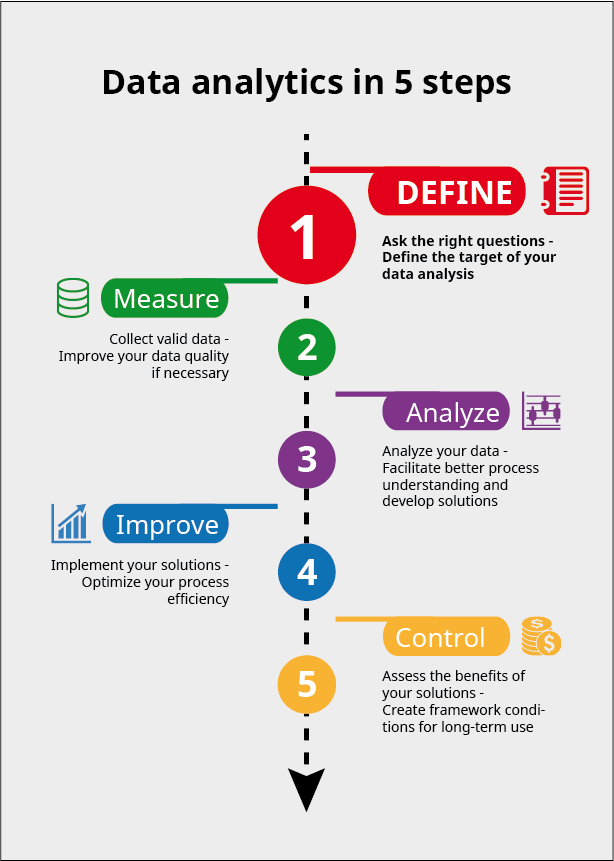
Post no. 2 – As announced in my blog post “Analyze your data – Success in 5 steps”, I’d like to take you step by step through the various steps of a data analysis. I intend to stick closely to the workflow described in the VDI Status Report on Opportunities with Big Data – Best Practice. This workflow is based on the proven Six Sigma DMAIC method. In today’s post, I’ll be dealing with the “Define” step.
Data analysis – yes or no?
When is a data analysis recommended? In the end, it all boils down to the economic benefits. If your production costs fluctuate heavily, if you’re unable to achieve the required product quality or stability, or if your products require multiple treatments, then it’s worth taking a closer look. If you’re familiar with the functional relationships, of course, you can take intervene directly. If that isn’t the case but you’ve got enough valid data already, you should estimate the potential benefits of a data analysis.
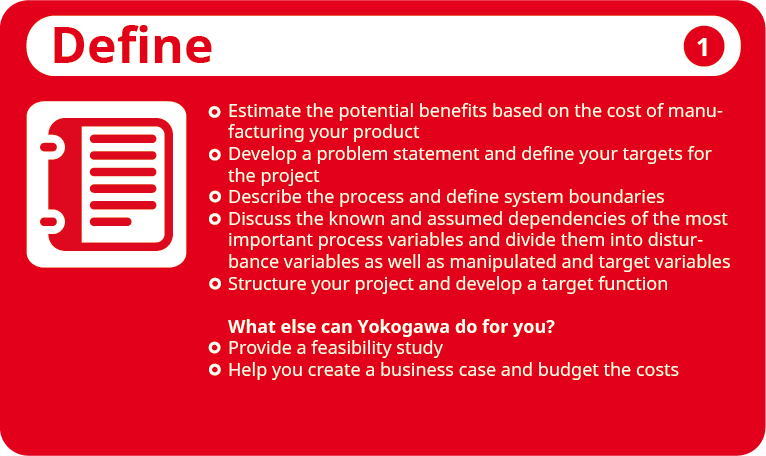
The cost of manufacturing your product is a suitable KPI for this purpose. If possible, you should consider all costs for raw materials and resources, energy consumption and disposal. Provided all quality requirements are met, these can be calculated either per unit manufactured or for a particular quantity of product, depending on the process. And depending on the problem statement, you can naturally also use other, process-specific parameters such as the length of a batch or discrete parts which do not comply with the specifications. If you evaluate this data over a long period of time – preferably twelve months – you can estimate the potential benefits based on the degree of fluctuation. The VDI Status Report indicates a rule of thumb whereby an ideal data analysis project can reduce the fluctuation of a KPI by at least one power of ten.
Have you got a problem?
It doesn’t necessarily have to be a huge problem. Many people wait until their problem starts to grow out of control before they take action, yet you can often achieve an economic benefit simply by improving a process that is in fact already running stably. You could succeed in cutting costs, for instance, enhancing quality or boosting productivity. These are the most common goals people set themselves. At the same time, however, you should be careful not to neglect those aspects which are not directly measurable in economic terms. Reducing the burden on the operator or helping to avoid stress situations are just two examples that give your team a chance to focus their full attention on the process and respond proactively.
It may not always be possible to achieve all of your goals at once; indeed, some could have limitations which render them mutually exclusive. You should therefore subject the process to a careful review and prioritize the goals in line with the problem statement. Above all, you should make every effort to define the system boundaries directly at the start of the project. This will help you describe the process and develop a goal statement, which is a step you should carry out at the end of the “Define” step based on the goals identified and the process description.
Describe the process
Once you have developed a goal statement, various other questions arise which can be divided into two main categories: the data situation itself and plant operation taking account of all existing experience. As the starting point for this debate, you must analyze the plant structure and establish which processing steps should be included in the model. Next, you should describe the individual steps with the help of a flow diagram. You can then define the boundaries of the analysis depending on your goal. It doesn’t always make sense to analyze the entire process.
However, the process stage you are considering often directly impacts on downstream stages, and it’s vital not to overlook these effects in the context of cost optimizations. If your goal is a root cause analysis, for example in order to evaluate product quality, the upstream stages could also be decisive. Start with the assumed cause but don’t become obsessed with it. Even though you’ve defined system boundaries, you should nevertheless keep a close eye on the process as a whole.
Ask specific questions
I’d like to share a few basic questions with you which in my experience are particularly useful for describing the process.
– How is the plant operated? Which variables are controlled how and based on what criteria?
– What are the key performance indicators associated with your process?
– Which (non-controllable) disturbance values are assumed to have an influence on the system?
– What correlations are assumed to exist between the KPIs?
– Where do problems tend to occur in the production process?
– Which constraints or limit values must be observed without fail?
– How great is the willingness to intervene in the process? Since data driven models cannot be extrapolated, or only to a very limited degree, it is recommended practice – especially in connection with optimization projects – to run the process at specific operating points, in order to increase the data density in states which only occur infrequently. I’m not talking here about the design of experiments which is the norm in Six Sigma projects, because DoE is virtually impossible in highly automated processes. However, if potential for optimization is identified in a range in which the plant has never or only rarely been operated, you should clarify the willingness to gradually run the process in this operation range taking account of all safety aspects.
– Where do the technical limitations lie? It could be desirable to vary certain parameters, but which is impossible for technical or operational reasons.
– Does an operating manual exist, so that discontinuities in the process can be reconstructed later?
– Are there any changes to the operating conditions or plant conversions which need to be considered?
Structure your project
It is a great help if you structure your project from the outset. That’s why it makes sense to define system boundaries. You should also categorize the process variables before you go any further. These are as a start disturbance variables, in other words measured values which you cannot control but which have an influence on the process, for instance the outdoor temperature or certain raw material properties. manipulated variables are parameters which you can change directly and which can therefore be used for optimization purposes, such as a temperature or a flow rate. It is particularly important to specify the target variables. These parameters quantify the attainability of your goal. The quality of a product is the simplest example here, of course.
Thanks to this classification, you can now formulate a functional relationship between the disturbance variables and the manipulated variables on the one hand and the target variables on the other. This function serves as the starting point for your analysis but is also a useful optimization function following the analysis, provided you take account of all barriers.
Let’s recapitulate
Did you find this information interesting?
If so, please stick with me for the next blog post, in which I’ll be getting to grips with Step 2 Measure. Various pitfalls which could be crucial to the success or failure of your data analysis are lurking in this phase – in the end, it all hinges on the quality of your data. Learn what aspects you need to consider and where problems could arise.
If you have any questions, observations, criticisms or suggestions regarding this blog post – or a future post – feel free to write us a comment!
Did you miss a blog post?
No problem – all posts in this series can be accessed here:
– Previous post: “Analyze your data – Success in 5 steps”
– Next post: “Analyze your data – Step 2: Measure”
– Post no. 4: “Analyze your data – Step 3: Analyze”
– Post no. 5: “Analyze your data – Step 4: Improve”
– Post no. 6: “Analyze your data – Step 5: Control”