Let’s recapitulate: The “Analyze” step
Post no. 5 – The Analyze step laid the foundation for improving the process in the sense of the goal statement you developed during the Define step. It was probably preparing the data you collected during the Measure step that was the hardest part. It’s particularly important that the cause and effect are stored in the same data set and that, as far as possible, your database is free from inconsistencies. The more precisely you work here, the better your analysis results and your models will be.
Translate your results into action
Taking the results of your correlation analysis or a valid model as a starting point, you can now proceed to the “Improve” step.
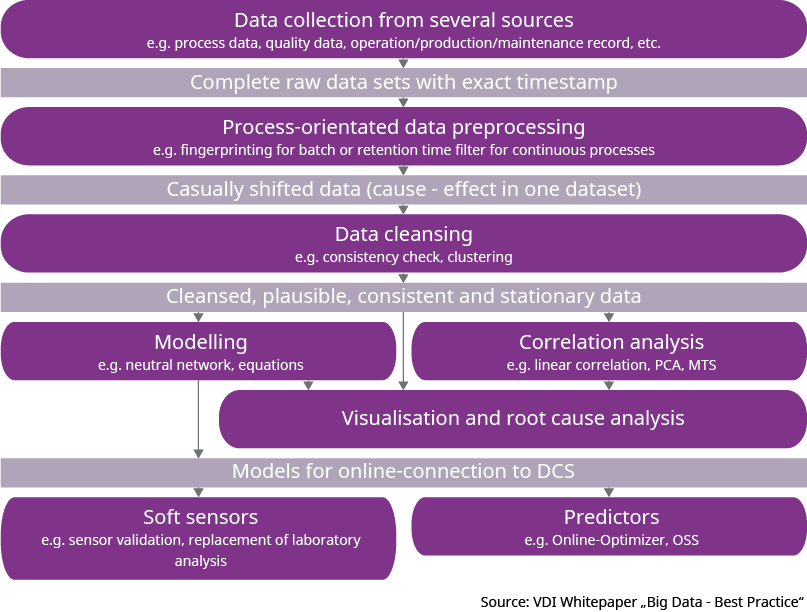
My Analyze post included a schematic diagram of the procedure for this step. That diagram also showed the next step: “Improve”. The potential for process improvements will almost certainly be greatest if you connect the models online to your DCS / PLC. However, I don’t want to reduce the “Improve” step to this alone, because the analysis could also produce results which you could implement by making simple adjustments to the process.
The “simple” option
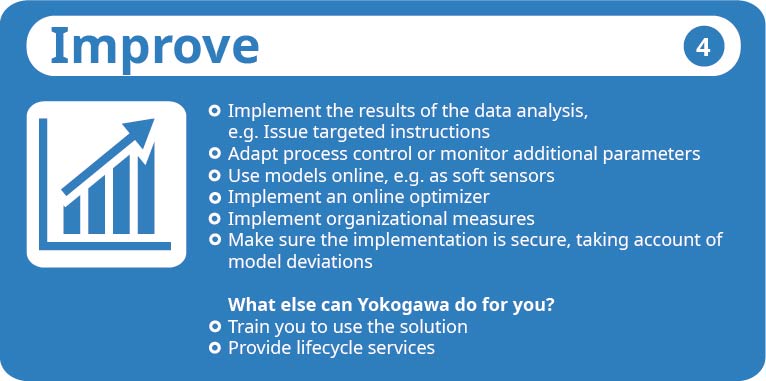
Connecting models online provides you with various kinds of feedback on your process in real time. However, depending on the nature of the solution, this could prove to be extremely laborious. Online and real time are all very well, but there’s little point in using a sledgehammer to crack a nut. You should therefore consider before you start whether it might be feasible to achieve a process improvement by adapting or extending the control concept, for instance, or by issuing targeted instructions. Maybe your analysis showed that upgrading the measurement technology and monitoring an additional parameter will be sufficient to produce the desired effect. In particular, you should be careful not to disregard organizational measures – an aspect that is often overlooked in the jungle of technical options.
Process monitoring
If you can implement the results of your analysis in the process using the measures described above, that will obviously be a big help. Wouldn’t it be fantastic if there was a comparatively simple solution to all of our problems? Unfortunately, correlations tend to be more complex than that in reality. A large number of parameters have to be monitored, which means it isn’t always easy to predict undesirable states. That’s why you can also use models to monitor the process and warn you if an abnormal situation arises. If you created a model based on historical data during the Analyze step, you can connect it to the process in such a way that online data is fed to it continuously. Now compare the information which is output by the model with the values that were actually measured. If there are any deviations, that’s probably because the process has changed.
If you prefer, you can also use the Mahalanobis distance, which we at Yokogawa calculate with our Process Data Analytics software using the Mahalanobis-Taguchi method. You can make this available to the operator as a kind of process quality parameter – an intuitive signal that is easy to understand. If the distance exceeds a certain value, there’s something wrong with the process. The operator can thus be warned in good time of any abnormalities such as quality issues. Since, in addition to this, you are always told which parameters are contributing most towards the increased distance, you can get going very quickly on the root cause analysis and initiate targeted countermeasures.
Early detection of abnormality before the quality issue happens; for more information, see this post.
Analysis with soft sensors
In any process, quality parameters in particular are determined with the help of analyzers or laboratory measurements. There is generally a certain time lag before you are supplied with the results, so that these parameters can’t be used to control the process. Soft sensors – in other words sensors based on software – can provide a remedy here. If you can manage to find surrogate parameters which can be measured online, so that you can map a laboratory or analyzer measurement in a model, you can integrate this model into your process as a soft sensor. The information which is output by the model gives you a substitute measured value in real time.
If you created the model for a continuous process, for instance, by assigning the cause and effect using a residence time filter such that the target variables are referred back to the input variables, the model you obtain here will enable future states to be predicted. Of course, this presupposes that the conditions, or the input variables, remain constant over the entire forecast horizon – a requirement which naturally cannot always be strictly complied with. Nevertheless, it provides you with a good pointer to the way your process will develop.
Another task for which soft sensors are suited is testing setpoints. You can let the operator test setpoints directly on the model in this way. This kind of operator support system (OSS) creates an additional decision option without having to intervene in the process.
Online optimization
Of course, you can also automate the operator’s test instruments. By combining the model with a method which determines the ideal set of setpoints under the given process conditions, you can use this system as an online optimizer. You must make certain when you integrate it that the input variables in your model are continuously checked for plausibility and that they undergo the same processing steps which you used when you created the model. Apart from this, you need a clear goal statement, which you should preferably have developed during the Define step. Since you will generally use data driven models which cannot be extrapolated, or only to a very limited degree, you must ensure that the monitoring conditions for the optimizer are sufficiently strict. It is a good idea here for your models to be integrated in an advanced process control (APC) strategy.
It sounds complicated. I don’t want to be accused of exaggerating but I have to admit that implementing an optimization concept like this entails quite a substantial effort. However, depending on the level of automation, you end up with a process management system that can respond to process changes in real time and, at best, requires no additional operator intervention. I deliberately say “at best” here, because such a complex system like must be accepted by the operator. To achieve this, it often makes sense to initially show optimizations as recommendations only. It can then be left up to the operator to decide whether or not to put them into practice. You lose some of the benefit of a true real-time system as a result of this; on the other hand, you increase confidence in – and understanding of – the method.
Safety first
It’s something that should really be taken for granted, but I’ll say it again just in case: make the security of your application a top priority, especially if you’re using models online. Every model is inherently susceptible to errors. You should therefore only employ models which have been extensively validated, and you should monitor their quality continuously while using them online. Since the majority of models cannot be extrapolated, or only to a limited degree, nonconformances are particularly likely when you depart from known operating points. If the models are integrated in a large application, secure use is once again a vital prerequisite. Make sure that all limit values and barriers are permanently observed. If values are written back to the process, all interventions must be matched to the process dynamics. The communication interfaces must likewise be continuously monitored.
Let’s recapitulate
I’m sure you’re longing to know what effect your improvements have actually had, no matter whether they involved “simply” changing control parameters or the use of online optimizers. That will be the subject of my next blog post on the “Control” step. I hope you’ll stick with me! I look forward to talking to you again and of course to receiving your comments on this post!
Did you miss a blog post?
No problem – all posts in this series can be accessed here:
– Post no. 1: “Analyze your data – Success in 5 steps”
– Post no. 2: “Analyze your data – Step 1: Define”
– Post no. 3: “Analyze your data – Step 2: Measure”
– Previous post: “Analyze your data – Step 3: Analyze”
– Next post: “Analyze your data – Step 5: Control” available 02/14/2018