CellPathfinder R3.08.02 has been released on May 23, 2025.
The recommended GPU for using Deep Learning functionality has been changed.
The intuitive, easy-to-use interface guides the user from analyzing thousands of image data in various angles to visualize the result by generating numerous graph types.
In addition, the Machine Learning and Deep Learning function increase the target recognition capability dramatically. It is also ideal for the analysis with the complexity and high-degree-of-difficulty such as analyzing the data from 3D culture and live-cell imaging.
The CellPathfinder software is a powerful tool for HCA.
You can download trial software. Software download
CellPathfinder Resolves Difficulties
For screening
CellPathfinder resolves screening bottlenecks.
- A specialized interface for inspecting multiple samples makes image comparison easy, improving efficiency.
- Advanced analysis using AI is possible through simple operation, even for beginners.
- Various graph creation functions and simple image and video creation, reducing hassles at the time of reporting.
For cancer research and regenerative medicine screening
CellPathfinder provides leading HCA through proprietary analysis technology.
- Label-free analysis of samples that you do not want to stain is possible using Yokogawa’s proprietary image generation technology “CE Bright Field”.
- Newly-developed easy-to-use Machine Learning and Deep Learning make previously difficult phenomena detection easy.
- Detection of rare events (CTC, etc.) with high speed and high accuracy.
Applications

Details
Simple workflow from images to analysis and graphs
1. Display image data

・Easy to compare images between wells
2. Load and execute analysis protocol

・Easy-to-understand graphical icons
・Choose a preset template for your analysis
3. Gating

・Specific populations can be extracted by gating the feature value data of recognized objects
・The extracted populations can be analyzed further
4. Make the graphs

・Various graph options to visualize the results
・The link between graph and images enables quick visual check of images by clicking data points
5. To examine further details…list the profiles of interesting cells

・Images and numerical data can be collected by clicking cells
Basic analysis functions
3D analysis
・Analysis of Z-stack images in three-dimensional space. ・The volume and the location of objects in 3D space can be quantified.

Image Stitching
Tiled images are generated through image stitching and analyzed, allowing for accurate quantification.
Ideal for analysis spanning across fields, such as of spheroids, tissue sections and neurites.

NEW!
Support for downsampling
When spatial resolution is not required, fast analysis is possible.
It also makes it easier than ever to handle huge tiled images.

Manual Region definition
Manual region of analysis regions is possible for complex trends that are difficult to identify through automated image processing.
Morphology in the defined regions can be visualized, facilitating analysis.

Data provided by Dr. Yasuhito Shimada, Mie University Graduate School of Medicine
Convenient Graphing Tools
Analysis results can be displayed by Bar chart, Line chart, Pie chart, Scatter plot, Heatmap, and Histogram.
In addition, EC50, IC50 and Z'-Factor of the analysis results can be calculated.


3D Viewer
3D reconstruction
The functionality of the 3D viewer has been greatly enhanced,
allowing you to easily create high-definition 3D images from Z-stack data.
 Movie Play
 |
Data Provided by The Japan Wool Textile Co. Ltd. |
Various display methods
Supports Ray casting and MIP 3D image display methods. Object recognition
results obtained via image analysis can also be displayed in 3D.
|
Original 3Dimage(Ray casting) |
Original 3Dimage(MIP) |
|
|
|
|
Object recognition results |
Overlay of original 3Dimage(Ray casting)and |
Easy comparison by displaying original 3D images, object recognition results,
and their overlays side-by-side.

Easily change wells displayed in 3D with a single click.

Convenient Tools
"Navigation" display is useful for knowing which part of the entire image is being enlarged.
 Navigation Movie Play
Data provided by Baylar College of Medicine
Freely visualize the internal structure of objects by displaying XY, XZ, and YZ
cross-sections, and by using the clipping and cropping functions.
|
Cropping Movie Play |
Clipping |
XY、XZ、YZ cross-section Movie Play |
 |
Data provided by Nippon Shokubai Co., Ltd. |
Create snapshots and movies.
Movies can be rotated, panned, and zoomed in and out while displayed in 3D.
 Movie Play
 |
Data Provided by The Japan Wool Textile Co. Ltd. |
A variety of optional functions enable various analyses
The Basic Pack includes the basic functions necessary to acquire various quantitative data on the morphology and brightness of cells from fluorescence images.
In addition, by adding optional functions, a variety of analyses that are not possible with the basic pack become possible.
Contrast-Enhanced Bright Field
By using Yokogawa's "CE Bright Field" proprietary image creation technology, two types of images can be output from bright field images.
This is a powerful pre-processing function for analysis using the Deep Learning function of Bright Field images.

Phase-type: Images such as those taken by phase-contrast microscopy.
It is useful for high-precision recognition of cell contours and analysis of cell phenotypes.
Fluor-type: Fluorescence-like images, It is useful for nuclear recognition, etc.
Machine Learning
Machine Learning functionality allows for unbiased digitization in experiments evaluated through appearence.
Furthermore, automated shape recognition can be performed by simply clicking on the shape you wish the software to learn.

Same Region over time
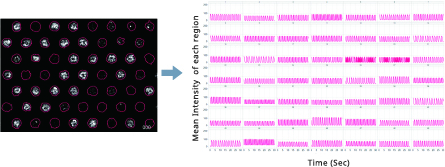
The fast calcium oscillations of cardiomyocyte and neuronal activities can be represented as waveforms by measuring intensities in the same region throughout the time-lapse.

Object Tracking
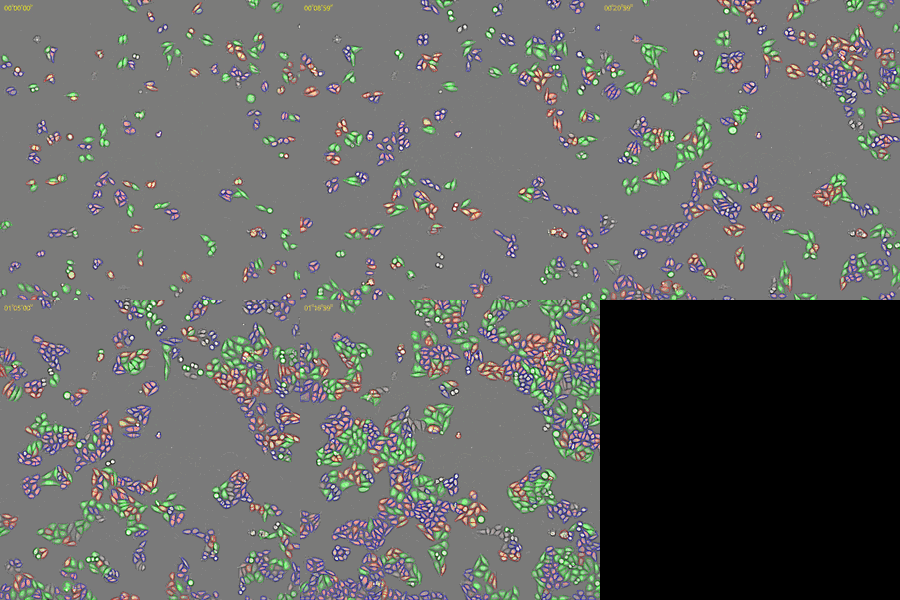
You can monitor dynamic cell behavior by tracking indivisual cell.
It can also track daughter cells after cell division, enabling analysis of cell lineage.
![]()
Classification(Gate)
Cells can be classified into groups of cells with similar characteristics.
This function enables to evaluate the number of cells and the ratio of cells in each cell group, and the feature quantities in each specific cell group.

Cell Recognition (Deep Area Finder)
You can recognize targeted objects, such as cells and intracellular organelles by painting them using not only fluorescence images but also bright field images.
This function is useful when the analysis accuracy with conventional analysis methods are not enough.

Original image

Recognition result
Cell Counts (Deep Cell Detector)
This function detects cells with simple operation of enclosing cells.
No expertise is required.
It is possible to count cells in high-density on bright field images as well as flourescence images.

Original image

Recognition result
Cell Classification (Deep Image Gate)
You can classify phenotypes that are difficult to quantify but appear to be "something different".
Simple operation of selecting the cell groups to be classified.
No need to select effective features or set thresholds.
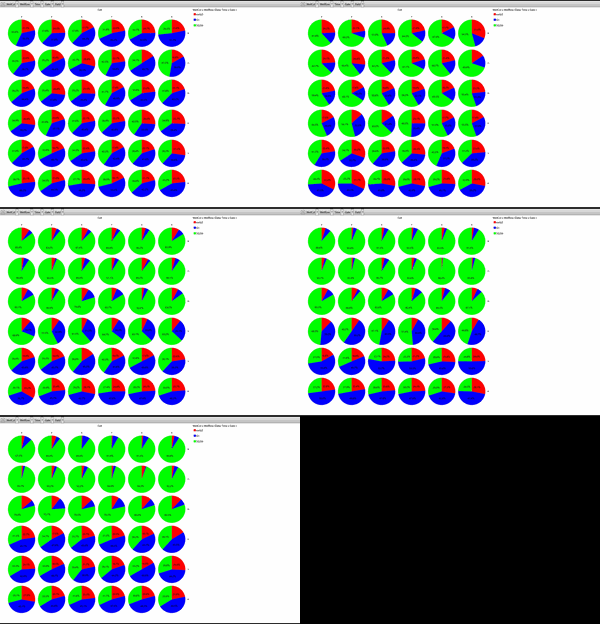
Classification of cell cycle (G1, Early S, SG2M) using the Fucci system
- Added 0–6.8μM etoposide to HeLa cells with Fucci
- 48-hours time lapse at 1-hour intervals at 10x; 488nm and 561nm

Control

6.8uM Etoposide

Ratio of cells in each cell cycle at each well.
EC50/IC50 Calculation (Deep Image Response)
This function enables comprehensive quantification of complex phenotypes using whole images.
Simple operation of slecting negative and positive wells and entering compound concentration information.
Any protocol to segment cells is not necessary.

Offering Total Solutions, Best for Your Needs
Plate transport via rebot, acquisition using CellVoyager CV8000 or CQ1, data management using CellLibrarian, and image analysis using CellPathfinder.
We offer optimum combinations matched to users' needs and budgets.

Large image: Click
Related products
 |
 |
|
 |
 |
|
 |
 |
|
※Data acquired in CellVoyager CV1000 are not supported.
※CellPathfinder system contain the software and the workstation.
System configuration
・Software
・Workstation
・Displays
Specifications of the workstation
Model : Dell Precision
CPU : Intel® Xeon
Memory : 128 GB
HDD : System(C:) 4TB or 1TB Storage, (D:) 4TB
OS : Windows® Microsoft Windows10 IoT Enterprise
GPU : NVIDIA® Quadro P620, T400, Quadro RTX5000 or RTX A4500
Display : 2560x1440 Dual monitors
Yokogawa Life Science
| @Yokogawa_LS | |
| Yokogawa Life Science | |
| Yokogawa Life Science | |
| •YouTube | Life Science Yokogawa |
We post our information to the following SNSs.
Please follow us.
Yokogawa's Official Social Media Account List
Recursos
- Colony Formation
- Scratch Wound
- Cytotoxicity
- Neurite Outgrowth
- Co-culture Analysis
- Cell Tracking
Cell stage categorized using FucciTime lapse imaging of Fucci-added Hela cells was conducted over 48 hrs at 1 hr intervals. Gating was performed based on the mean intensities of 488 nm and 561 nm for each cell. They were categorized into four stages, and the cell count for each was calculated.
Fluorescent ubiquitination-based cell cycle indicator (Fucci) is a set of fluorescent probes which enables the visualization of cell cycle progression in living cells.
We have been developing a prototype of a genomic drug test support system using our CSU confocal scanner. This system administers chemical compounds that serve as potential drug candidates into living cells, which are the most basic components of all living organisms, records the changes in the amount and localization of target molecules inside cells with the CSU confocal scanner and a highly sensitive CCD camera, and processes and quantifies the captured high-resolution image data.
In this tutorial, we will learn how to perform cell tracking with CellPathfinder through the analysis of test images.
In this tutorial, a method for analyzing ramified structure, using CellPathfinder, for the analysis of the vascular endothelial cell angiogenesis function will be explained.
In this tutorial, we will learn how to perform time-lapse analysis of objects with little movement using CellPathfinder, through calcium imaging of iPS cell-derived cardiomyocytes.
In this tutorial, we will observe the change in number and length of neurites due to nerve growth factor (NGF) stimulation in PC12 cells.
In this tutorial, image analysis of collapsing stress fibers will be performed, and concentration-dependence curves will be drawn for quantitative evaluation.
In this tutorial, we will identify the cell cycles G1-phase, G2/M-phase, etc. using the intranuclear DNA content.
In this tutorial, spheroid diameter and cell (nuclei) count within the spheroid will be analyzed.
In this tutorial, a method for analyzing ramified structure, using CellPathfinder, for the analysis of the vascular endothelial cell angiogenesis function will be explained.
In this tutorial, using images of zebrafish whose blood vessels are labeled with EGFP, tiling of the images and recognition of blood vessels within an arbitrary region will be explained.
In this tutorial, intranuclear and intracytoplasmic NFκB will be measured and their ratios calculated, and a dose-response curve will be created.
Descargas
Videos
YOKOGAWA will contribute to technology evolution particularly in measurement and analytical tools to help build a world where researchers will increasingly focus on insightful interpretation of data, and advancing Life Science to benefit humanity.
¿En busca de información adicional sobre Yokogawa Iberia, tecnología y soluciones?
Contáctenos


