Six contribution areas
Based on the results of the materiality analysis, we have set six contribution areas in order to achieve the sustainability goals of the “Three Goals,” which are the vision for society toward 2050.GS2028 focuses on business activities that contribute to six areas, aiming to expand contributions to society and environment and achieve dramatic business growth.
Six contribution areas and priority issues

| Contribution area | Priority issue |
|---|---|
| Achieving carbon neutrality | Reducing GHG emissions and enabling the transition to affordable, reliable, and sustainable forms of energy |
|
Improving efficiency in society & industry |
Optimizing production, enabling autonomy, and facilitating the efficient use of resources and energy through DX |
| Optimizing plant lifecycle & protecting environment | Supporting both the long-term optimal operation of plant assets and the reduction of their environmental footprint |
| Improving health & safety | Promoting life-related innovation and improving safety in plants and communities |
| Creating a resource-recycling ecosystem | Fostering the development of the bioeconomy and a circular economy |
| Creating workplaces where people can fulfill their potential | Establishing an equal opportunity workplace where employees can be treated with dignity and fulfill their potential |
We will promote the expansion of our contribution to society and environment through medium to long term “social impact indicators.” In addition, we will promote business growth through “business activity indicators” set for each business and “sustainability transition sales,” which measure the business volume of growth areas that contribute to the sustainability of the Group.
Sustainability Indicators for the Three Goals
| Target Year | Item | Description |
|---|---|---|
| 2050 | Three Goals | Yokogawa's vision for society |
| 2030 | Social Impact Indicators | Indicators set from the perspective of long-term social impact for the priority issues in the six contribution areas. |
| 2028 | Sustainability Transition Indicators | The sales of businesses in growth areas that contribute significantly to sustainability transitions, which has been calculated in order to promote business growth while also expanding contributions to sustainability. |
| 2028 | Business Activity Indicators | Targets set for each business in defined focus areas for promoting sustainability transitions. |
Social impact indicators
We will further accelerate contribution while continuing to use the “Social Impact Indicators” established in the previous medium-term Business plan.
We conduct materiality analysis when setting each indicator.
>> Click here for materiality analysis
| Contribution area | Indicator | FY30 (FY50) target | FY25 result | |
|---|---|---|---|---|
|
Achieving carbon neutrality
|
CO2 emissions control amount through customers (accum. from FY18) | 1 billion t-CO2 | 440 million t-CO2 | |
| GHG emissions (Scope1,2) (base year FY19) | Achieve carbon neutrality by FY2030⋆1 ⋆1 The plan is to reduce GHG emissions by 90%, with the remaining 10% of emissions expected to be offset through carbon credit |
59.9% reduction | ||
| GHG emissions (Scope3) (base year FY19) | 30% reduction by FY30 (vs. FY2019)⋆3 Achieve carbon neutrality by FY2050⋆2 *2This assumes a direct reduction of GHG emissions by 90%, with the remaining 10% of residual emissions offset through carbon credits. ⋆3Reductions in Category 1 (purchased goods and services) and Category 11 (use of sold products) |
0.7% reduction⋆3 |
||
|
Improving efficiency in society & industry
|
Economic value created by improving customer productivity efficiency | 2 trillion yen by FY30 |
306.0 billion yen |
|
| Energy consumption (Intensity per sales, base year FY23) | 30% improvement by FY30 (average 5% improvement per year) |
34.8% reduction |
||
|
Optimizing plant lifecycle & protecting environment
|
Number of plants/factories where Yokogawa has contributed to sustainable operations | 20,000 plants by FY30 |
5,496 plants |
|
| Water intensity (water withdrawals / sales, base year FY23) | 20% reduction by FY30 |
7.3% reduction |
||
|
Improving health & safety
|
Total number of people whose health & safety have been enhanced through solutions provided by Yokogawa's customers | 100 million people by FY30 |
77.18 million |
|
| Frequency rate of occupational accidents (number of lost time accidents and no lost time accidents / aggregate number of work-hours × 1,000,000) | 0.40 or less by FY30 |
0.89 |
||
|
Creating a resource-recycling ecosystem
|
Environmental value created throughout the product lifecycle |
Promoting long-term use of products |
— |
|
|
Creating workplaces where people can fulfill their potential
|
Engagement to enhance employee well-being | 84% or more by FY30 |
82% |
|
| Achievements in human resource development and capacity development for transformation | Advancement of employee ability to fulfill future requirement for Yokogawa’s future. (including skill improvement) |
We promoted efforts to update and enhance our human resources portfolio for the realization of our |
||
| Achievement level of diversity, equity & inclusion | Proportion of women in managerial positions: 20% by FY2030 Increase diversity in upper decision-making levels |
15.5% |
||


Calculation of social impact indicators
We aggregate the difference between customers’ CO2 emissions from renewable energy-related business or low-carbon energy production, and average CO2 emissions from fossil fuels usage, then record is as a result.
| Area of contribution | Indicator | Calculation method |
|---|---|---|
| Achieving carbon neutrality | CO2 emissions control amount through customers (accum. from FY18 to FY30) |
The CO2 emissions difference between customers’ CO2 emissions from renewable energy-related business or low-carbon energy production, and average CO2 emissions from fossil fuels usage |
| Greenhouse gas emissions (Scope 1, 2)(base year: FY2019) | Calculate based on the GHG protocol | |
| Greenhouse gas emissions (Scope 3)(base year: FY2019) | ||
| Improving efficiency in society & industry | Economic value created by improving customer productivity efficiency |
Calculated by estimating the amount of productivity improvement benefits for customers to whom Yokogawa provides products and services |
| Energy consumption (Intensity per sales, base year FY2023) | Calculated by dividing the group's energy consumption by consolidated sales. | |
| Optimizing plant lifecycle & protecting environment | Number of plants/factories where Yokogawa has contributed to sustainable operations | The amount of water supplied to the water purification plant contributed by Yokogawa, is converted to the amount of water required for daily life per person, then record is as a result. |
| Water withdrawals (Intensity per sales, base year FY2019) | Calculated by dividing the group’s water withdrawals by consolidated sales | |
| Improving health & safety | Total number of people whose health & safety have been enhanced through solutions provided by Yokogawa’s customers | The amount of water supplied to the water purification plant contributed by Yokogawa, is converted to the amount of water required for daily life per person, then record is as a result. |
| Total reportable incidents frequency rate | Number of accidents / aggregate number of work-hours × 1,000,000 | |
| Creation a resource-recycling ecosystem | Environmental value created throughout the product lifecycle |
― |
| Creating workplaces where people can fulfill their potential | Engagement to enhance employee well-being | Global employee engagement survey scores for the result |
| Achievements in human resource development and capacity development for transformation | Monitor progress using the human resources portfolio satisfaction rate in the business CMUs and training hours per person. | |
| Achievement level of diversity, equity & inclusion |
Proportion of women in managerial positions |
Sustainability Transition Indicators
Our business environment is undergoing major changes, including the energy situation, rising geopolitical risks, and changes in social demands for decarbonization. Through all of its businesses, Yokogawa contributes to the sustainable development of society and industry, while also working to upgrade its business portfolio in response to changes in the business environment over the medium to long term. In order to realize a sustainable society, it is important to accelerate business growth in the areas of clean energy and energy transition, as well as to support customers’ sustainability transitions while addressing the diverse challenges and circumstances faced by customers across different regions and industries.
Based on such belief, in order to clearly indicate how each business should contribute and in which direction it should grow, we upgraded the sustainability transition indicators to management indicators that more integrally capture contribution to society and business growth, following discussions at the Sustainability Committee.
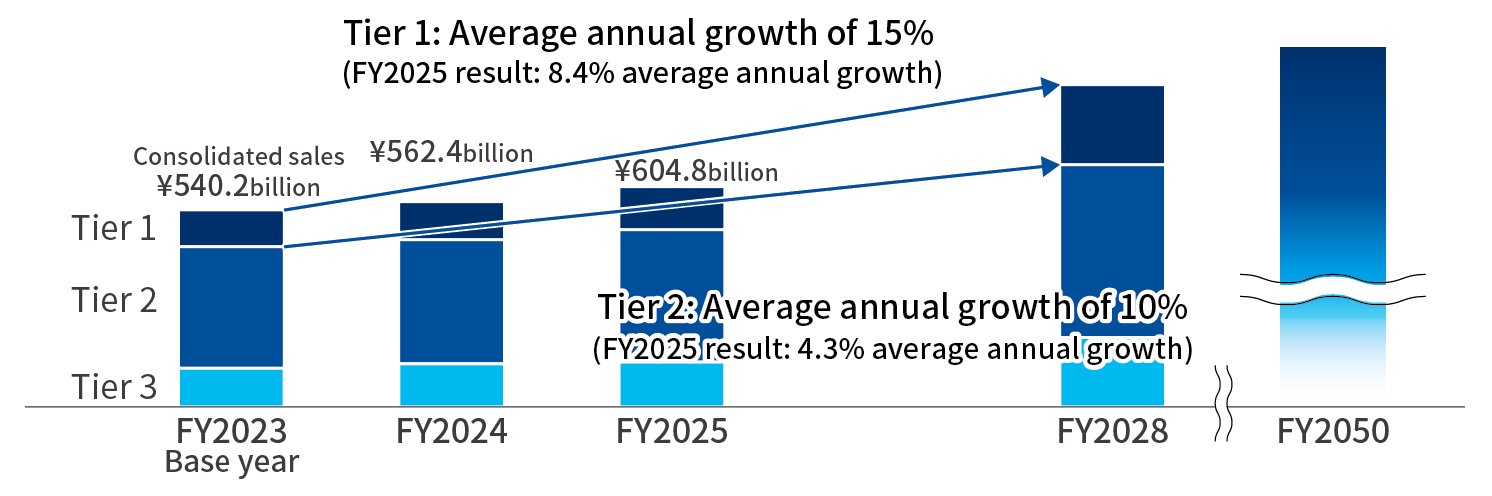
For fiscal year 2026 and beyond, we classify our business domains by industry into three tiers to make it clear how each tier should contribute to sustainability transitions.
Concept of sustainability transition indicatiors*1
| Classification | Industry group*2 | Way of contributing to sustainability |
Growth rate target |
|---|---|---|---|
|
Tier 1 |
Renewable energy, CCS and CCUS, water, pharmaceutical, healthcare, food & beverage, measurement, etc. | Contribute to a sustainable society as a whole through carbon neutrality and well-being | Achieve sales growth that far exceeds the GS2028 target rate (average annual growth of 15%*3) |
|
Tier 2 |
Natural gas, LNG, power, specialty and fine chemicals, mobility, mining & metals, pulp & paper, etc. | Contribute to the transition to a circular economy through energy transition and effective utilization of resources | Achieve sales growth on par with the GS2028 sales growth target (average annual growth of 10%*3) |
|
Tier 3 |
Oil and petrochemicals | Contribute to a prosperous and safe society by reducing environmental impacts | ─ |
Tier 1 is positioned as a priority growth area that will directly contribute to the realization of a sustainable society, and therefore we have set an average annual growth rate target of 15%, which is significantly higher than the group-wide sales growth rate target under GS2028 (average annual rate of 10% or more). For Tier 2, which is a domain that supports social transitions through energy transition and effective utilization of resources, we aim for an average annual growth of 10%.
Although no growth rate targets are set for Tier 3, it is an important area that supports society and industry, and therefore we will enhance our contribution to our customers’ safe and stable operations and the reduction of environmental impacts. These indicators have been introduced as a new framework for evaluating businesses from the perspectives of both social value and corporate value and to accelerate growth in domains that contribute greatly to a sustainable society, based on the premise that all businesses contribute to society. They point to the direction we are headed in promoting the reform of our business portfolio over the medium to long term.
*1 The Stated Policies Scenario (STEPS) of the World Energy Outlook (WEO) published by the International Energy Agency (IEA) was used as a reference when designing the index. According to STEPS, while fossil fuels including oil and natural gas will continue to be used on a certain scale in 2050, the fossil fuel-related fields are expected to gradually lose share after the 2030s, in line with changes in the energy demand structure.
*2 The composition of industries in each tier is determined by reference to the taxonomy standards published by public institutions, while also taking into consideration our business format and management practicality. We will continue to review the system in light of changes in social and industrial structures.
*3 The base year is fiscal year 2023.
Business Activity Indicators
We have identified key focus areas for advancing our sustainability transition and established targets for each business.