José Manuel García Casas, Marcos Ariel Kihn, Diego Ruiz Massa, Carlos Alberto Ruiz
Abstract
The Repsol Puertollano Industrial Complex has a crude oil distillation capacity of 7.5 million tonnes per year, with a conversion plant to petroleum coke, and an Olefins unit. The Puertollano refinery is technically the most complex of all the Spanish refineries, due to both the product variety and the integration of the units.
The energy system is based around eight steam pressure levels, with eight fired boilers producing medium pressure steam, two cogeneration plants producing steam and electricity, and also a set of boilers and furnaces producing high pressure steam. Several economic trade-offs provide challenges to operate the site wide energy system at minimum cost. For instance, the trade-offs among electrical system, steam and fuels networks. In addition, the Kyoto protocol introduces a new motivation to reduce CO2 emissions.
This paper describes the tasks performed together with Soteica, by using an on-line model, to help achieve site wide energy costs minimization. A detailed model of steam, fuels, electric, boiler feed water and condensates system has been built, contemplating all the real constraints and degrees of freedom for their operation. The electric power system is also modelled as it interacts with the steam production and usage. Such a model is continually validated with live data. A continuous calculation of equipment efficiencies is done as part of the performance monitoring activity of the model that is running as a service.
Other monitoring aspects include the continuous audit of the energy system so the data can be relied on for evaluating the value of energy production and usage, and waste can be eliminated. Recommendations given by the model are taken into account on daily basis.
The on-line model is also used in stand alone mode to perform case studies for planning for a better operation of the energy system. As a result of the project, the information of the refinery energy system has been organized in one model and within one environment that everyone has access to.
Furthermore, it allowed understanding the interaction among all the decision variables and associated constraints, which sometimes are hidden or ignored, and, additionally, it enabled the centralization of the responsibilities of operating the site wide system optimally.
1. Introduction
The Repsol Puertollano Industrial Complex has a crude oil distillation capacity of 7.5 million tonnes a year, with a conversion plant to petroleum coke, and an Olefins unit. The Puertollano refinery is technically the most complex of all the Spanish refineries, due to both the product variety and the integration of the units.
Several economic trade-offs provide challenges to operate the site wide energy system at minimum cost. For instance, the trade-offs among electrical system, steam and fuels networks. In addition, Kyoto protocol introduces a new motivation to reduce CO2 emissions. The main objective of the project was to provide a tool for the on-line optimization, auditing and monitoring the overall site wide energy system.
Such a tool could be also used for engineering studies such as evaluations of operational changes, investment projects, and shutdown and startups, taking into account both the technical and the economical impact on the energy system. The mentioned objectives have been defined taking into account the previous successful implementations performed using the same technology and by the same implementation team, at the following sites of Repsol YPF group: Repsol Tarragona refinery, Petronor Somorrostro refinery, Repsol La Coruña refinery, Repsol YPF La Plata refinery and Repsol Química Ensenada petrochemical complex.
Among the more than 40 sites that have implemented Visual MESA ON-LINE, some of them have it running in closed loop and others, as in the Repsol sites, in advisory mode:
- Closed loop implementation: the targets are sent directly to DCS and implemented and it usually runs 20-40 times a day
- Advisory mode: the targets are sent to operator and engineering screens and reports, full optimization solutions are obtained with such potential targets
Furthermore, working with Visual MESA in stand alone mode, case studies can be performed using up-to-date calibrated model and feeding it with actual or historical data.
Summarizing the benefits of the ON-LINE model, the following can be highlighted:
- Steam accounting and management
- Waste steam identification, big changes warning, steam cushion cost
- Emissions management and monitoring
- NOx constraint, CO2 trading
- Fuel and power network management
- Fuel and power complex purchase or selling contracts management
- Switchable drivers for pumps and compressors
- Advise motor/turbine switches
- Equipment performance monitoring
- Integration with process RTO's via utilities pricing
With respect to the stand alone use of VISUAL MESA, the following aspects shows to be the more beneficial:
- Utilities planning and scheduling
- Evaluate effect of production plans on utilities system
- How to run utilities system during upsets/shutdowns?
- Investment planning and assessment
- Invest in a new cogeneration unit?
- Plant expansion, process change
- Fuel and power contractual changes evaluation
- Assess contractual terms and negotiate better contracts
The following paragraphs describe some interesting aspects of Visual MESA implementation at Repsol Puertollano refinery, including the description of the main tasks performed together with Soteica, by using an on-line model to help achieve site wide energy costs minimization.
2. Energy system description
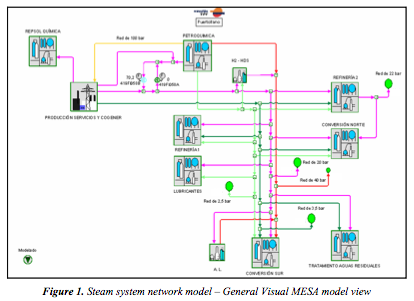
The energy system is based around eight steam pressure levels, with eight fired boilers producing medium pressure steam, two cogeneration plants producing steam and electricity, and also a set of boilers and furnaces producing high pressure steam. Figure 1 shows the Visual MESA model view at the higher level corresponding to the whole site steam network.
3. Implementation
The implementation has been performed during 2006. The following items describe the project schedule and some aspects of the software architecture.
3.1. Project schedule
The project schedule can be summarized in the following main steps:
- Start Up
- Control System Review
- Off-Site Building
- Mid-Point Review
- Burn-In Period
- Commissioning Visit
The following paragraphs briefly describe them.
3.1.1. Start Up
Data collection includes the Piping and Instruments Diagrams, tags list from Real Time Database (plant information system) and equipment data sheets.
Software installation and connection to Plant Information system is done at the beginning of the project. Software architecture is described at 3.2.
3.1.2. Control System Review
A review of the steam, power, and fuel control systems with knowledgeable experts has been performed. The goals of this Control System review have been:
- Develop a list of variables already controlled and how Visual MESA needs to relate to them
- Identify any needed new control strategies or changes to existing strategies to implement optimization
As a result, the optimization suggestions can be achieved properly through the existing operating and control procedures.
3.1.3. Off-site Model Building
A complete model of the overall Energy System was built. The model includes the whole fuel, steam, boiler feed water, condensate and electrical system. The eight steam pressure levels were modeled as well as all the units with a high level of detail, including all the consumers and suppliers to the respective steam, boiler feed water and condensate headers.
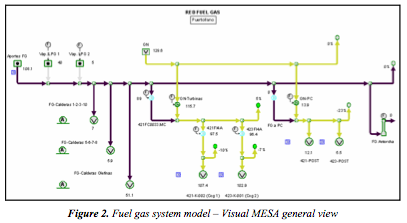
Electricity and fuels supply contracts details have been included in the model, being the electricity market cost updated from the real time data base system tags. The fuel gas network was also modeled, as it is involved with the steam and power generation equipment and all its constraints and degrees of freedoms were also taken into account by Visual MESA. It is shown on Figure 2.
Visual MESA optimization can be organized into four levels:
- Level 1: includes basically the pressure control related devices: boilers, letdown valves and vents.
- Level 2: adds the optimization of other continuous variables including turbo generators, steam injection, extraction/induction/condensing turbines, steam turbine, etc.
- Level 3: adds turbine-motor switching optimization (i.e., discrete variables).
- Level 4: adds equipment that would create "heartburn" if equipment moves were to be made, such as running a coker-feed pump with a turbine, with a motor standby, or equipment that you don't want to optimize. Running at level 4 can tell you the cost of your insurance policy.
A well tuned model would generally be run at level 3, with a run at level 4 once in a while to evaluate potential operational changes. The objective function Visual MESA optimizes is the total operating cost of the system, which is:
Total Operating Cost = Total Fuel Cost + Total Electric Cost + Σ Miscellaneous Costs
The SQP optimizer's job is to minimize this objective function subject to operating constraints in the system. Total fuel cost is determined from the fuel use of each boiler and combustion turbine multiplied by their respective fuel prices.
Total electric cost is determined from the net electric use of each motor, load, and generator multiplied by their respective electric prices. The electric generation (power selling) is just negative electric use. The model takes into account the electricity price corresponding to the actual hour of the day as well as the penalty associated to selling more or less power than the market arranged exportation amount.
Miscellaneous costs are normally used to charge for demineralized water coming into the system, but can be used for any other cost related to the energy system (for example CO2 emission cost). Calculations to model and optimize the CO2 emission cost have been developed and run together with the electric, steam and fuel optimization and help choose the best fuel to use in boilers and gas turbines taking into account the emission costs.
3.1.4. Mid-Point Review
The model and optimization configuration was reviewed with users. Training at engineering and users' level was performed, including the following items:
- Basic skills (model navigation and menus)
- Optimization
- Monitoring capabilities
- Case studies (what if planning)
- Building models
- Building custom reports
- Software architecture
3.1.5. Burn-In Period
Model fine adjustment and optimization results analysis is performed on day basis. Minor model modifications and addition or adjustment of constraints is done. At the end, operators use the tool every day.
3.1.6. Commissioning Visit
The model is in use by Operations for site wide costs minimization and as the energy watch dog. Economic benefits already obtained are commented and improvements for the future are discussed.
3.2. Software architecture
The model gets live plant data from the Plant Information System via standard OPC interface. The software is installed for two types of uses: Stand Alone use (Engineering station) and Client Server use (Operators and Managers stations):
- Client server use: The purpose is to share the solutions, supporting multiple users. Visual MESA server runs as service on a PC. It automatically runs with no interruption every 15 minutes, writing results on the plant information system and generating reports. Any PC connected to the plant network can be configured to access the model and the reports. Users can connect in many ways (HTML, Excel, Graphical User Interface)

- Stand alone use: The purpose of this installation is for individual users to be able to run case studies on their own PCs, using a snapshot of the current model or any other model the user may have built and the current data or historical data (automatically taken from the plant information system via standard OPC Historical Data Access).

4. Benefits
Among the benefits obtained by using Visual MESA, some examples are given in the following paragraphs.
4.1. Performance monitoring
Equipment efficiencies are calculated continually with validated data by Visual MESA. The results are historized in PI tags. This helps in equipment performance follow up and maintenance. It also helps in having the information to correlate the variation of real efficiencies with operating conditions so the optimizer can take that into account.
Figure 5 shows the example of performance monitoring for boilers, cogeneration units and compressors driven turbines.
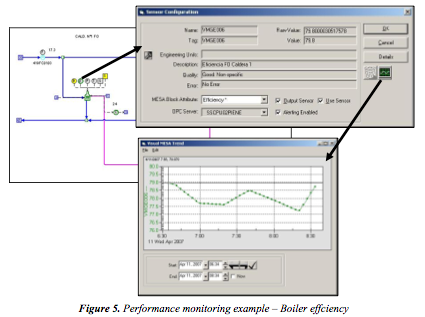
In this case the ASME standard efficiency calculation method is used by the model.
4.2. Auditing and Data validation
By auditing the energy system, imbalances can be identified and actions can be taken to reduce it. Therefore, the data can be more and more relied upon to evaluate the value of energy production and usage, and wastes can be eliminated. The methodology in Visual MESA is based on getting inaccurate meters fixed, because imbalances are inherent to every real world steam system header calculation. The way Visual MESA deals with imbalances is as follows:
- Wherever there is a closed-mass, or mass and energy balances, Visual MESA calculates a real-time balance offset or bias (the so called balloons in Visual MESA, see Figure 6).
- This offset is then held constant for optimization or case studies (treated as an unmeasured load).
- Various actions can be taken based on the size of the balance:
o Big imbalances are visually identifiable (the size of the balloon increases).
o Either visually or in an Excel report, Visual MESA will flag these large imbalances to the user who can then focus maintenance attention on the meters in that balance.
o If a particularly important sensor fails in the validation test, the software could automatically shut down optimization choices to which it is related or shut down the entire site optimization.

4.3. CO2 emissions reduction
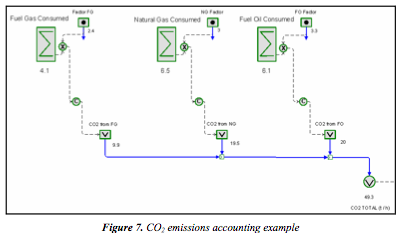
The cost of CO2 emissions is taken into account in the model together with all the purchase and supply contracts of fuels, steam and electricity. The inclusion of the CO2 model is configured according to the specificity of the site. The emissions factors for each fuel and also the costs associated to the CO2 emission are sent to the model from real time information system tags, having taken into account all contractual and operational alternatives of a given site. Figure 7 shows an example of CO2 emissions accounting:
The CO2 emission cost can be added to the optimization economical Objective Function (OF), so that when Visual MESA minimizes the OF, CO2 cost is taken into account together with all other costs (fuels, electricity, demineralized water, etc.). This way the optimum fuel feeds to boilers and gas turbines are recommended taking into account all such costs.
In principle, since the energy cost reduction is mainly achieved by a reduction in fuels consumption, the optimization will always imply a reduction in CO2 emission, except in those scenarios when the optimization recommends the use of a cheaper fuel that generates more CO2 instead of using a more expensive fuel that generates less CO2. This could be the case when replacing Natural Gas with a heavy liquid fuel. This challenging tradeoff is affected directly by the CO2 allowance price and how close the site is with respect to reaching its emission quota.
In many countries, a given industrial complex (this is the case of Repsol Puertollano refinery) has a quota assigned for total CO2 emissions. The site periodically reports the total generated CO2 related to fuels consumptions. At the end of the year, if the quota is exceeded, each ton of CO2 emitted above the quota has to be paid at a given market price. For instance, the price may be referred to the European Union Allowance (EUA), equivalent to one metric ton of CO2 emissions. In some countries, there is an additional tax, sometimes much more expensive than the allowance price, as a penalty for having exceeded the quota.
Also, if emissions are below the quota, the tons of CO2 left to complete the quota could be sold at the market price of the emissions allowance.
4.4. Real time optimization
First of all it is important to note some comments about the necessary sensors to optimize the energy system since it is usually common to have lack of sensors.
Most important sensors are the ones that are directly involved in optimization. For example, steam generators flows, letdown valves and vent flows.
In the cases of equipment where there is no direct measurement, sometimes it can be inferred using another measured value, for instance using valve opening for the letdown valves. Knowing the valve's flow characteristic (i.e., its Cv) it is possible to infer its flow.
Pump on/off status, especially for pumps that are directly involved in the optimization, should be determined automatically. In cases where that is not available, an operator manual input is done, or even better, any operator manually introduced data is replaced with automatically inferred status (i.e., based on amperage of the motors or steam - rpm in case of the turbines).
Important sensors are the ones that provide data for the model that will not be changed during the optimization, for example, reboiler steam flows, pressures and temperatures. Less important sensors are the ones that are only used for monitoring and do not impact the model optimization decisions.
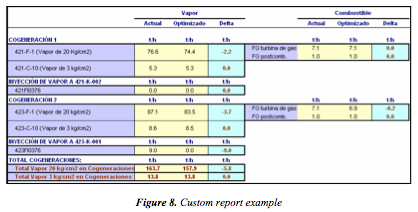
Operators have available a custom report (see the example in Figure 8).
If it is necessary to analyze particular results, the delta view (difference between optimized versus actual case) usually helps (see example in Figure 9).
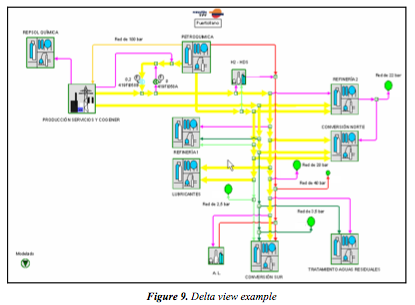
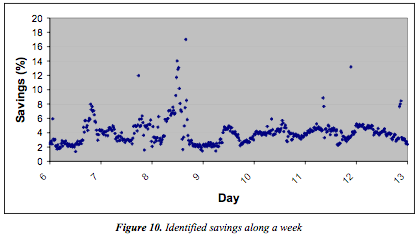
Figure 10 shows the savings found during a week of operation (in terms of % respect with respect to the total energy costs) according to the usual way operators perform without any advisory help. Each point in the plot corresponds to an automatic Visual MESA run.
5. Conclusions
Repsol Puertollano refinery uses an on-line model for site wide Energy costs minimization. The implementation project has allowed to organize the information of the refinery energy system in one model and one environment that everyone has access to, also to understand all the decision variables and the associated constraints, which sometimes are hidden or ignored, and even more important, has allowed the centralization of the responsibilities of operating the site wide system optimally.
The on-line model demonstrated to be robust, well suited to be used on a routine basis by operators and to perform case studies.
Continuous auditing of the energy system allows identifying imbalances and continuous performance monitoring allows preventing plant upsets and helps to quickly identify bad actors in the refinery. Coordination among plant areas to implement the on-line model recommendations was key to the success of this project.
REFERENCES
- "Online energy management", S. Benedicto, B. Garrote, D. Ruiz, J. Mamprin and C. Ruiz, PTQ Q1 2007, pages 131-138.
- "Industrial Energy Management using on-line models", Mamprin J., Ruiz D. Ruiz C., Workshop on Energy, organised by Global Technology Forum, Paris, November 16th, 2006.
- "Industrial Energy Management by Using an OnLine Tool" – David Nelson, Visual MESA, Susana Benedicto, Repsol YPF, Diego Ruiz and Carlos Ruiz, Soteica Europe, 2006, NPRA Plant Automation & Decision Support Conference. October 8 – 11, 2006 , Arizona Biltmore, Phoenix, AZ (USA).
- "Industrial Energy Management by using an on-line tool", Benedicto S., Garrote B., Mamprin J., Ruiz D., Ruiz C., (2006), ERTC Asset Maximisation Conference organized by Global Technology Forum, May 8-10, 2006, Vienna.
- "Energy System Real Time Optimization", Derya Uztürk, Howard D. Franklin, John M. Righi, Xander van Mechelen, Apostolos T. Georgiou, 2006, NPRA Plant Automation & Decision Support Conference. October 8 – 11, 2006 , Arizona Biltmore, Phoenix, AZ (USA).
- "Reducing refinery energy costs", Ruiz D., Ruiz C., Nelson D., Roseme G., Lázaro M. and Sartaguda M., Petroleum Technology Quarterly, Q1 2006, pages 103-105
- "Auditing and control of energy costs in a large refinery by using an on-line tool", Ruiz D., Ruiz C., Mamprin J., Depto Energías y Efluentes Petronor, (2005), ERTC Asset Maximisation Conference organized by Global Technology Forum, May 23-25, 2005, Budapest.
- "Energy Costs Reduction By Using an On-line Utilities Optimization Tool", Ruiz D., Ruiz C., Nelson D., Roseme G., Lázaro M. and Sartaguda M., (2004), ERTC Computing Conference organized by Global Technology Forum, May 17-19, 2004, London.
Related Industries
-
Power Generation
Since the 1970s, Yokogawa has partnered with power producers to squeeze every watt of efficiency and resilience from assets old and new. Today our 30,000+ CENTUM control systems and 230 service hubs span 100 countries, uniting domain know‑how, ISASecure™‑certified automation, and real‑time analytics. Whether you run a single gas turbine or a continent‑wide renewable fleet, we deliver the insight, safety, and speed you need to thrive in a decarbonizing grid.
-
Oil & Gas Downstream
The oil & gas downstream industry has been facing an increasing number of challenges in recent years. These include the changing characteristics of the feedstock to be processed, aging of process facilities and equipment, rising cost of energy, lack of skilled plant operators who can run a refinery safely and efficiently, and the ever-changing requirements from both the market and the customer.
Over the years, Yokogawa has partnered with many downstream companies to provide industrial solutions focused on solving these challenges and problems. Yokogawa's VigilantPlant solutions have helped plant owners to achieve maximum profitability and sustainable safety within their plants.
Have Questions?
Contact a Yokogawa Expert to learn how we can help you solve your challenges.

