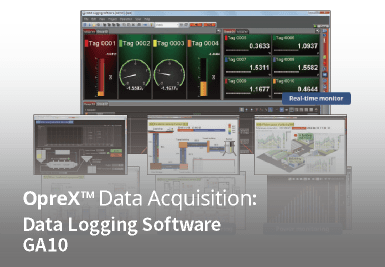
Monitors and records data from a variety of instruments via networks
GA10 is PC-based data logging application software for monitoring and recording by connecting devices distributed in a factory or on the premises via Ethernet network. The centralization of PCs will improve the efficiency of monitoring and recording operations and reduce the burden.
New! AI supports detecting predictive abnormality sign of equipment.
>> Automatically detects and notifies the “anomalies” that are signs of abnormalities. You can prevent production stoppage due to unanticipated equipment failure, and operate the factory stably.
New! Factory energy visualization function has been added.
>> By adding the integration display function, the entire energy in the factory can be visualized and operation costs can be reduced through comprehensive monitoring.
Benefits of GA10 introduction:
- Collecting data can be prepared in 3 steps
- Unified monitoring using custom screens tailored to uses
- Cost-savings through demand monitoring
1.Acquire
► Collect scattered data
All the data is acquired by connecting the various devices installed in a factory to an Ethernet network.

*1 Sushi Sensor XS770A is now released in Japan, south-east Asia, and Europe. For other areas, Yokogawa is making efforts to expand regions by developing each region model and getting local certifications such as explosion proof and radio.
*2 GX/GP/GM(/CM□, /CS□ option), GX70SM: Sales for Japan, Korea, and USA only. UPM: Sales for Japan, Korea, India, Southeast Asia, and Taiwan only.
► Simple settings
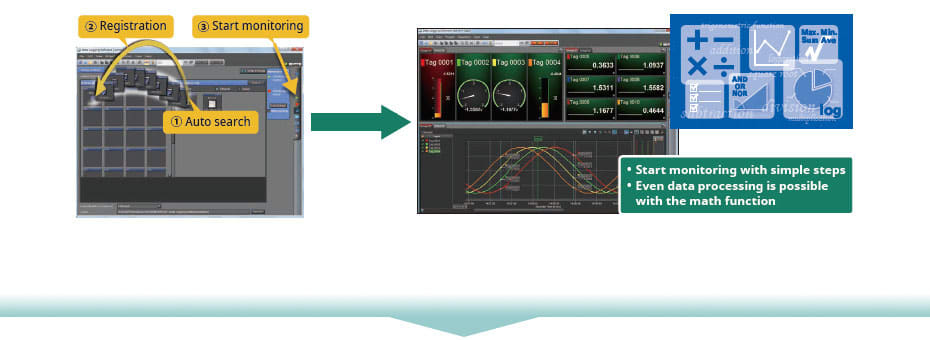
Simply select the devices to connect and you are ready to acquire data. With data loggers and recorders, tag names are automatically reflected and multi-channel acquisition can be started easily.
In addition, data processing is easy using the math function (option).
2.Monitor
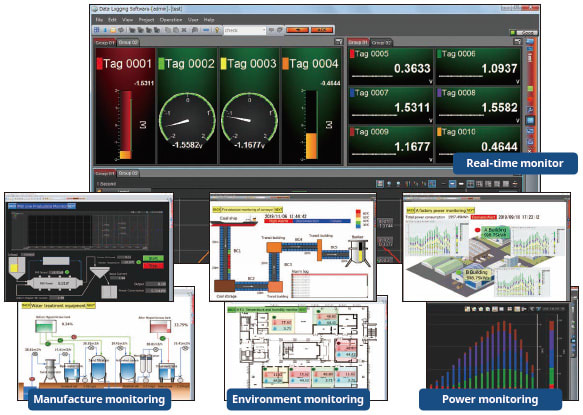
► Monitor screen depending on the application
Real-time monitoring is possible with simple settings.
In addition, you can create an original monitor by customizing the monitor screen depending on your application.

► Check errors quickly
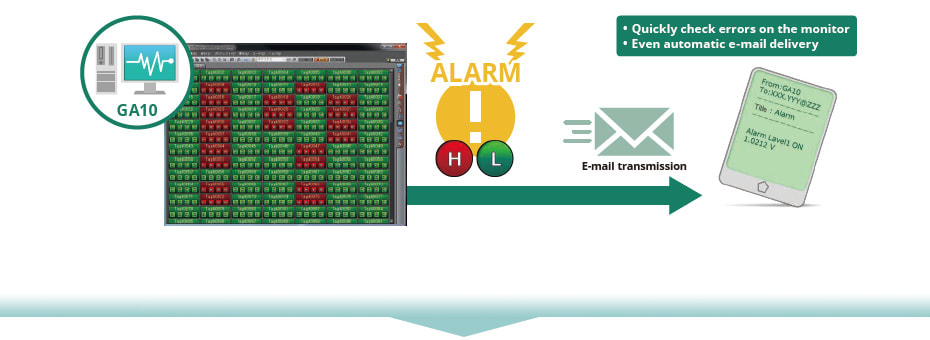
Quickly check errors with the alarm monitor. When an alarm occurs, a beep is sounded on the PC.
In addition, the e-mail function sends e-mails based on conditions such as alarm occurrence, specified period, specified time, and communication error.
3.Recording / Utilization
► Reliable monitoring and data storage
Collected data is recorded reliably in binary or Excel format. You can view the recorded data using the dedicated viewer.
► Automatic report output to Excel, PDF or printer
Reports can be output to a printer automatically based on recorded data. Further, you can customize the layout and output the report to Excel, PDF files or printer.
► NEW! FTP transfer function
Reports and recorded files can be automatically transferred using the FTP function.

Details
Useful Functions for Monitoring and Operation
► Build an easy-to-use monitoring screen
The custom display function (option) can be used to freely create a screen with your favorite design for monitoring and operation. The value of a connected device (Modbus device) can be changed by operating the buttons or the like on the custom screen.

► Privileges for each user
Access privileges can be assigned to each user.
Select from Manager: configuration/operation/monitoring, Operator: operation/monitoring, and Monitor: monitoring.

► Transfer data to other systems
Data can be transferred to SCADA PLC using the OPC-UA server function (option) or Modbus server function.

>> Click here for "Monitoring/Operation" application examples
Functions Useful for Evaluation and Testing
► Data analysis while collecting and recording
Many useful functions are available for data analysis, which can also be used to analyze data while collecting and recording data.
New! Detailed analysis can be performed during data recording with the dedicated viewer.
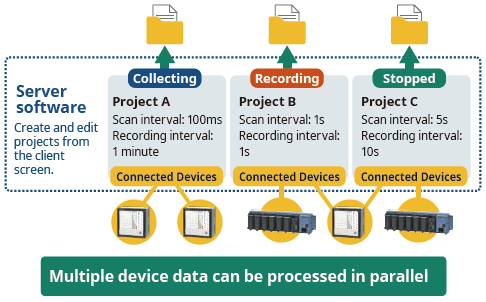
► Multiple projects
Recording is possible using separate timings for each piece of test and production equipment.
*Up to 30 projects can run simultaneously.
► High reliability
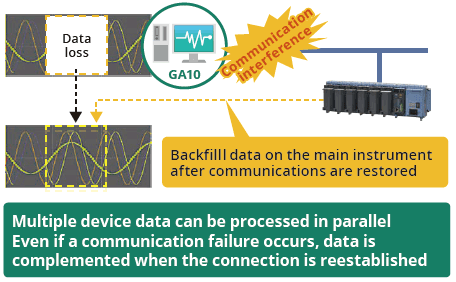
The data storage function (backfill function) automatically complements data when communication is disconnected (set the acquisition mode to Device time, when a GX/GP/GM/DX/MV is in use).
Using AI to monitor for anomaly sign New!
Preventing production stoppage due to unanticipated equipment failure, and operate the factory stably
AI can learn what normal operating data “looks like” by acquiring measured data on the GA10 from Sushi Sensor, recorders, loggers, and other devices implemented to the production equipment. This enables it to identify anomaly data and notify the user. Anomaly Detection looks at correlations among multiple data to make determinations, and can be utilized to catch signs of equipment abnormalities that are difficult for humans to discern.
> Click here for details on AI functions

Comprehensive monitoring by visualizing factory energy New!
► Support for visualizing power
The integration display function (option) collects electrical energy and flow rate data measured by wattmeters and flowmeters and helps to visualize energy with integration graphs and demand monitoring. In addition, the report function can be used to automatically output daily and monthly reports.
The energy in the factory can be monitored comprehensively
▶ Comprehensively monitor multiple groups
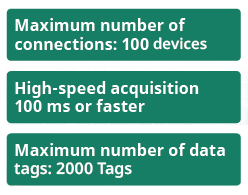
Up to 2000 tags can be monitored.
▶ Easy visualization with custom display
The power usage status can be visualized in an intuitive manner by customizing 920MHz the display screen.
▶ Support peak cuts with demand monitoring
Demand monitoring enables graph display and alarm notification.

*2 GX/GP/GM(/CM□, /CS□ option), GX70SM: Sales for Japan, Korea, and USA only. UPM: Sales for Japan, Korea, India, Southeast Asia, and Taiwan only.
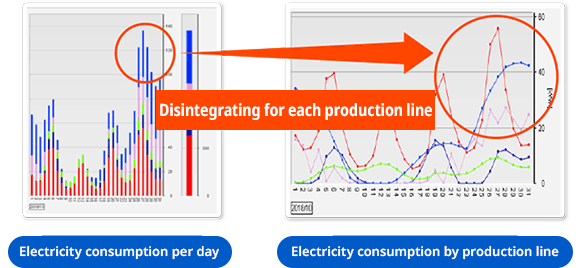
Improvements can be seen in the integrated bar graph and trend display
Improvements can be seen in the integrated bar graph and trend display. Monitoring the total energy usage with the integrated bar graph. Electricity costs can be reduced by reassessing each line according to the integrated trend and reviewing the production plan so that the peaks of power usage on each line do not overlap.
Early detection of power excess by demand monitoring monitor
A reference value is set with the demand monitor and constantly monitors for excess power. When power is exceeded, email alert transmission and alarm sound are performed immediately and can be detected early.

>> Click here for "Energy Visualization" application examples
Examples of monitoring and operation applications
►Example 1: Monitor the equipment operation status in production building
GA10 can monitor the operation status of equipment in the entire factory, summarized by each production building.
►Example 2: Monitor and operate production equipment
The status of production equipment can be monitored on a custom screen. Only authorized users can operate from the screen.
Examples of evaluation and experiment applications
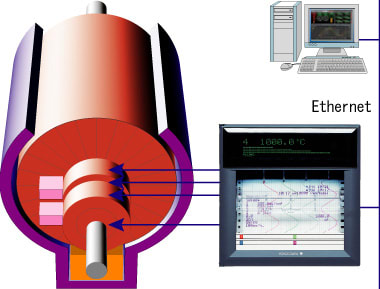
►Example 1: Simultaneous evaluation tests of multiple generators
Evaluation tests can be performed on different types of generators in parallel in multiple projects.
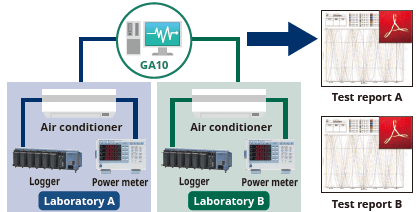
►Example 2: Air conditioner performance test
In an air conditioner performance test, data from all laboratories can be collected, and the recorded data can be saved for each room. A weekly test report can be output automatically.
Examples of factory visualization applications
►Example 1: Monitoring of factory wastewater treatment
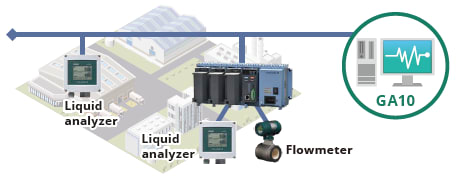
Data such as ph, turbidity, odor, and flow rate of wastewater treatment equipment can be collected with GM10 (Data Logger) or directly, and the entire wastewater treatment can be monitored on GA10.
►Example 2: Fire detection of belt conveyors
DTSX (optical fiber temperature sensor) is used to measure the temperature of the belt conveyor at intervals of 1 m. Fires can be detected easily with the GA10’s color-coded display.
►Example 3: Detection of abnormal signs in equipment
Sushi sensors (XS770A/integrated wireless vibration sensor) are installed on compressors and motors, and data is collected by GA10. This data can be used to detect abnormal signs and analyze failures.
►Example 4: Temperature and humidity monitoring of a warehouse
GX70SM (battery type wireless temperature sensor) is installed in a warehouse, and the temperature, humidity, and battery status are collected by GA10. This allows the warehouse to be monitored without worrying about the sensor battery.
*1 Sushi Sensor XS770A is now released in Japan, south-east Asia, and Europe. For other areas, Yokogawa is making efforts to expand regions by developing each region model and getting local certifications such as explosion proof and radio.
*2 GX/GP/GM(/CM□, /CS□ option), GX70SM: Sales for Japan, Korea, and USA only. UPM: Sales for Japan, Korea, India, Southeast Asia, and Taiwan only.
Assortment of connection devices
Broad support covering loggers, recorders, temperature controllers, signal conditioners, power monitors, and power meters. It even acquires data from Modbus devices. The acquired data can be viewed from multiple monitoring PCs.
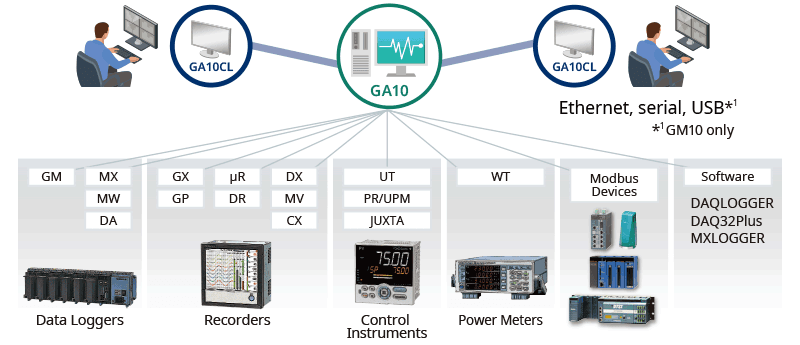
Connectable Devices and Software
| Products to be connected | |
|---|---|
| Data Logger | GM10, MX100, MW100, DA100 |
| Recorder | GX10, GX20, GP10, GP20, DX1000, DX1000N, DX2000, DX1000T, DX2000T, FX1000, FW1000, MV1000, MV2000, CX1000, CX2000, μR10000, μR20000, DR130, DR230, DR240 |
| Control Instrument | UT75A, UT52A, UT55A, UT35A, UT32A, UP55A, UP35A, UM33A, YS1500, YS1700 |
| Connect the following as Modbus instruments FA-M3V (F3SP7x), PR300, UPM100, UPM101, VJU7, VJS7, VJA7, VJH7, VJP8, VJQ7, VJQ8, VJX7, MVHK, MVRK, MVTK |
|
| Power Meter | WT300, WT500, WT1800*, WT1600*, WT3000, WT3000E |
| Modbus Device | Instruments supporting Modbus communication |
| Software | DAQLOGGER, DAQ32Plus, MXLOGGER |
* Free connection software GateWT for GA10 available.
-
【Support Information】PC Software Support Model List
list of compatible models which various PC software is supported.
Resources
As manufacturing capacity expands, manufacturing facilities are required to increase the capacity of compressed air in order to provide adequate support to meet demand output.
Prevent costly downtime and process equipment failures with real-time pressure monitoring. Yokogawa’s Sushi Sensor is the optimal choice for industries depending on bottled gas in essential procedures.
Yokogawa’s Sushi temperature sensor is a cost-effective, reliable, long-range wireless communication for monitoring and recording to boost reliability, and also able to configure the network with redundant gateways for chemical manufacturers.
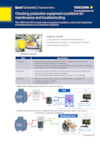
When maintenance work of production equipment or trouble occurs, customers want to check the situation at the site immediately.
They also want to prepare easily for that (building a measurement system).
In response to these demands, the VZ20X and GA10 make it easy to construct a DATA collection system (on-site confirmation system) and quickly check the status of production equipment.
Appliance testing typically require 100% quality check prior to shipping. Early life cycle test and outgoing quality check is instrumental in measuring the product's power consumption, heat dissipation, cabin temperature and safety. The test parameters must be logged and analyzed to ensure the product performs to the quality standards.
Environmental data (water quality, amount of flow) is measured on-site and monitored from an office.
Appliance testing typically require 100% quality check prior to shipping. Early life cycle test and outgoing quality check is instrumental in measuring the product's power consumption, heat dissipation, cabin temperature and safety. The test parameters must be logged and analyzed to ensure the product performs to the quality standards.
As water and wastewater systems expand, scalable centralized monitoring enables efficient management of distributed assets and meets evolving user demands.
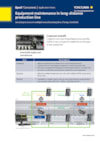
Customer can cover long-distance area and the VZ20X is very compact to install into small space of any equipment .
Due to revisions and additions to regulations, pumps used in water, sewerage, and drainage systems require flexible modifications and additional measurement points in their performance inspections.
In response to these changes in the environment and circumstances, the compact size of the Multi-Sensing Remote I/O Analog Sensing Unit VZ20X reduces the burden of expanding and reconstructing production and test equipment to fit the current installation environment.
the VZ20X installed near sensors such as temperature, humidity, and vibration, and enables automatic collection of data via the factory LAN. The data collection, monitoring and management can be automatically and regularly monitored with the data logging software GA10. As a result, it contributes to reducing the workload of workers.
When maintenance work of production equipment or trouble occurs, customers want to check the situation at the site immediately.
They also want to prepare easily for that (building a measurement system).
In response to these demands, the VZ20X and GA10 make it easy to construct a DATA collection system (on-site confirmation system) and quickly check the status of production equipment.
In the painting process of automobile parts, failure or corrosion of electrodes can lead to quality degradation.
In addition, the current lack of electrode condition monitoring has resulted in the replacement of electrodes in a short period of time, a problem that is extremely costly.
To address these issues, we monitor the deterioration of production facilities and contribute to the realization of maintenance tailored to the conditions of the equipment.
Customers want to monitor the amount of electricity consumed by each production equipment in order to conserve energy in the factory, but it is not easy to install a measurement system in existing equipment, even from the installation and wiring conditions.
The VZ20X's compact size allows it to be installed for existing conditions. Accurate sensing also contributes to the visualization of power usage at production equipment.
Since performance evaluation tests of inverter drive motors are susceptible to noise, equipment with high noise resistance is required. Also, if the number of measurement points is large, a multi-channel measuring instrument that satisfies the measurement will be costly.
The VZ20X is noise-resistant and safe for accurate DATA collection even on noise-prone measurement targets such as inverters.
It is hard to go back and forth between the office floor and the test floor to check the bearing durability status.
That round trip time is wasteful and a heavy burden on man-hours. If you have more than one test floor, that's even more of a burden.
The VZ20X and GA10 make it possible to build simple monitoring systems. The system also enables remote monitoring of manufacturing and testing sites, contributing to reducing the burden on the site.
DATA of several production equipment in a semiconductor manufacturing factory is currently being checked by field workers, and the checking is in a difficult situation. Therefore, there is a growing demand for centralized monitoring within the factory.
The VZ20X allows installation to take advantage of existing space.
In addition, the GA10 contributes to labor saving in the field by remote monitoring.
Customers want to improve maintenance by predicting failures of existing durable equipment. However, existing equipment do not have enough space, and it is not easy to increase the number of sensors needed to grasp the condition.
To address this issue, the VZ20X’s compact size allows it to be installed between equipment, and data collection can be easily monitored via Ethernet (Modbus/TCP).
Customers want to improve maintenance by predicting failures of existing durable equipment. However, existing equipments do not have enough space, and it is not easy to increase the number of sensors needed to grasp the condition.
To address this issue, the VZ20X’s compact size allows it to be installed between equipments, and data collection can be easily monitored via Ethernet (Modbus/TCP).
You can measure and monitor integral flow (total and excess flow). You can also calculate the flow integral and excess usage with computation functions, and generate reports with the Report function. With the Excel template function, you can create templates in a desired report format for creating reports automatically.
Customers want to improve maintenance by predicting failures of existing durable equipment. However, existing equipments do not have enough space, and it is not easy to increase the number of sensors needed to grasp the condition.
To address this issue, the VZ20X’s compact size allows it to be installed between equipments, and data collection can be easily monitored via Ethernet (Modbus/TCP).
In recent years, customers of processing equipment used in food and pharmaceutical manufacturing have increasingly requested visualization of equipment conditions.
This is because we do not know the current state of our production facilities, and maintenance depends on individual experience and intuition.
By accurately collecting DATA with VZ20X and visualizing the status of equipment, it is possible to understand the current status and perform appropriate maintenance according to the condition of the equipment.
The PLC in the existing injection molding machine does not have a recording function, but you want to add a function to record the production DATA and equipment condition DATA. Customers also want to easily realize these functions.
In response to these requirements, the VZ20X performs DATA collection of PLC and analog sensors, and the GA10 provides on-site monitoring and recording to support safer operations.
Downloads
Brochures
Instruction Manuals
- Model GA10/GA10CL/GA10UP Data Logging Software User's Manual (9.2 MB)
- GA10 Data Logging Software Downloading the Latest Software and Manuals (340 KB)
- Modbus Device Definition File Creating Tool for GA10 Data Logging Software (813 KB)
- SMARTDAC+ STANDARD Universal Viewer User's Manual (4.1 MB)
- DXA170 DAQStudio User's Manual (4.8 MB)
- WX1 GateWT User's Manual (859 KB)
General Specifications
- GA10 Data Logging Software (766 KB)
Technical Information
Videos
GA10 is PC-based data logging software for monitoring and recording data by connecting to devices distributed in a factory. Now with an AI-based Anomaly Detection function, the AI notifies you of anomalies before equipment abnormalities occur.
Looking for more information on our people, technology and solutions?
Contact Us