


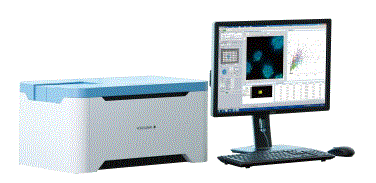
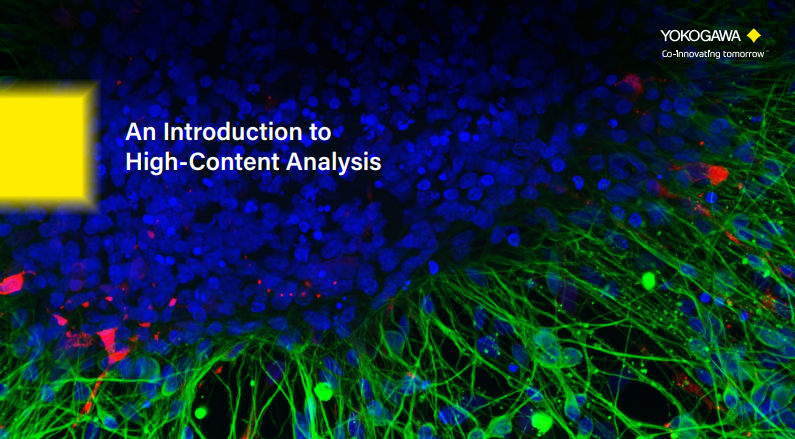
CellPathfinder, High Content Analysis Software
Leverage industry-leading technology to optimize cell imaging processes.
A powerful tool for high content imaging, the cell image analysis software analyzes and digitizes complex high content imaging experiment data. From 3D culture systems to live imaging, users can easily access multiple evaluation systems, capitalizing on the cell trace software’s machine learning functions to dramatically increase target recognition and decrease slow turnarounds.
- Intuitive interface guides users through processes
- Machine learning continually improves process success
- Provides abundant analysis functions to individualize research
- Compatible with Total Solutions
- Supports label-free samples
- Provides multiple graphing options with a streamlined, easy-to-use interface
CellPathfinder Resolves Difficulties
For screening
CellPathfinder cellular imaging system resolves screening bottlenecks.
- A specialized interface for inspecting multiple samples makes image comparison easy, improving efficiency
- Advanced analysis using AI is possible through simple operation, even for beginners
- Various graph creation functions and simple image and video creation, reducing hassles at the time of reporting
For cancer research and regenerative medicine screening
CellPathfinder provides leading HCA through proprietary analysis technology.
- Label-free analysis of samples that you don’t want to stain is possible using Yokogawa’s proprietary image generation technology “CE Bright Field”
- Newly-developed easy-to-use machine-learning (standard function) makes previously difficult phenomena detection easy
- Detection of rare events (CTC, etc.) with high speed and high accuracy
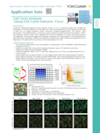
Applications

Details
Simplify workflow from images to analysis and graphs
1. Display image data

・Easy to compare images between wells
2. Load and execute analysis protocol

・Easy-to-understand graphical icons
・Choose a preset template for your analysis
3. Gating

・Specific populations can be extracted by gating the feature value data of recognized objects
・The extracted populations can be analyzed further
4. Make the graphs

・Various graph options to visualize the results
・The link between graph and images enables quick visual check of images by clicking data points
5. To examine further details - list the profiles of interesting cells

・Images and numerical data can be collected by clicking cells
Basic Analysis Functions
3D Analysis
Analysis of Z-stack images in three-dimensional space. The volume and the location of objects in 3D space can be quantified.

Label-Free Analysis
The recognition of cells without the use of labeling is possible using images created with CE Bright Field technology.
Time, cost, and effects on cells due to fluorescent labeling are eliminated from phenotype analysis.

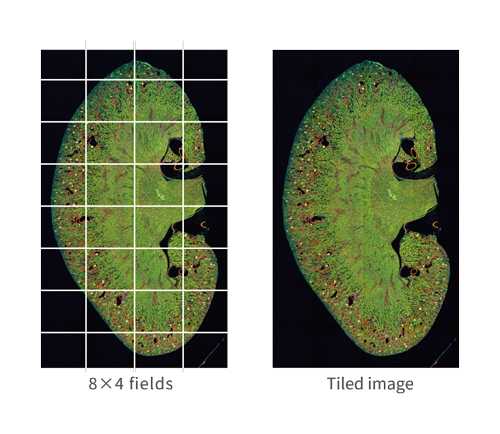
Image Stitching
Tiled images are generated through image-stitching and analyzed, allowing for accurate quantification.
Ideal for analysis spanning across fields, such as spheroids, tissue sections, and neurites.
Support for Downsampling
When spatial resolution is not required, fast analysis is possible.
It also makes it easier than ever to handle huge tiled images.

Manual Region Definition
Manual region of analysis regions is possible for complex trends that are difficult to identify through automated image processing.
Morphology in the defined regions can be visualized, facilitating analysis.

Data provided by Dr. Yasuhito Shimada, Mie University Graduate School of Medicine
EC50/IC50 Calculation (Deep Image Response)
This function enables comprehensive quantification of complex phenotypes using whole images.
Simple operation of selecting negative and positive wells and entering compound concentration information.
Any protocol to segment cells is not necessary.

Convenient Graphing Tools
Analysis results can be displayed by Bar chart, Line chart, Pie chart, Scatter plot, Heatmap, and Histogram.
In addition, EC50, IC50, and Z'-Factor of the analysis results can be calculated.


A Variety of Optional Functions Enable Various Analyses
The Basic Pack includes the basic functions necessary to acquire various quantitative data on the morphology and brightness of cells from fluorescence images.
In addition, by adding optional functions, a variety of analyses that are not possible with the basic pack become possible.
Contrast-Enhanced Bright Field
By using Yokogawa's "CE Bright Field" proprietary image creation technology, two types of images can be output from bright-field images.
This is a powerful pre-processing function for analysis using the Deep Learning function of Bright Field images.

Phase-type: Images such as those taken by phase-contrast microscopy.
It is useful for high-precision recognition of cell contours and analysis of cell phenotypes.
Fluor-type: Fluorescence-like images, It is useful for nuclear recognition, etc.
Machine Learning
Machine Learning functionality allows for unbiased digitization in experiments evaluated through appearance.
Furthermore, automated shape recognition can be performed by simply clicking on the shape you wish the software to learn.

Same Region over time
The fast calcium oscillations of cardiomyocyte and neuronal activities can be represented as waveforms by measuring intensities in the same region throughout the time lapse.

Object Tracking
You can monitor dynamic cell behavior by tracking individual cells.
It can also track daughter cells after cell division, enabling analysis of cell lineage.
![]()
Classification(Gate)
Cells can be classified into groups of cells with similar characteristics.
This function enables the evaluation of the number of cells and the ratio of cells in each cell group, and the feature quantities in each specific cell group.

Cell Recognition (Deep Area Finder)
High-accuracy recognition of targeted areas, such as cells and intracellular organelles.
This is effective when the accuracy of existing recognition techniques is not enough, and the expertise in image analysis is not available.

Original image

Recognition result
Cell Counts (Deep Cell Detector)
Intuitive cell counting
Detect cells without establishing a complicated image analysis protocol. Particularly effective for analyzing high-density cultured cells and bright field analysis.

Original image

Recognition result
Cell Classification (Deep Image Gate)
Classification of recognized cells into any grouping.
You can intuitively categorize complicated phenotypes without selecting feature quantities.
Classification of cell cycle (G1, Early S, SG2M) using the Fucci system
- Added 0–6.8μM etoposide to HeLa cells with Fucci
- 48-hours time lapse over 1 hour intervals at 10x; 488nm and 561nm

6.8uM Etoposide

Control

Ratio of cells in each cell cycle at each well.
EC50/IC50 Calculation (Deep Image Response)
This function enables comprehensive quantification of complex phenotypes using whole images.
Simple operation of selecting negative and positive wells and entering compound concentration information.
Any protocol to segment cells is not necessary.
Improved EC50 Calculation
Convenient Graphing Tools
Analysis results can be displayed by Bar chart, Line chart, Pie chart, Scatter plot, Heatmap, and Histogram.
In addition, EC50, IC50, and Z'-Factor of the analysis results can be calculated.
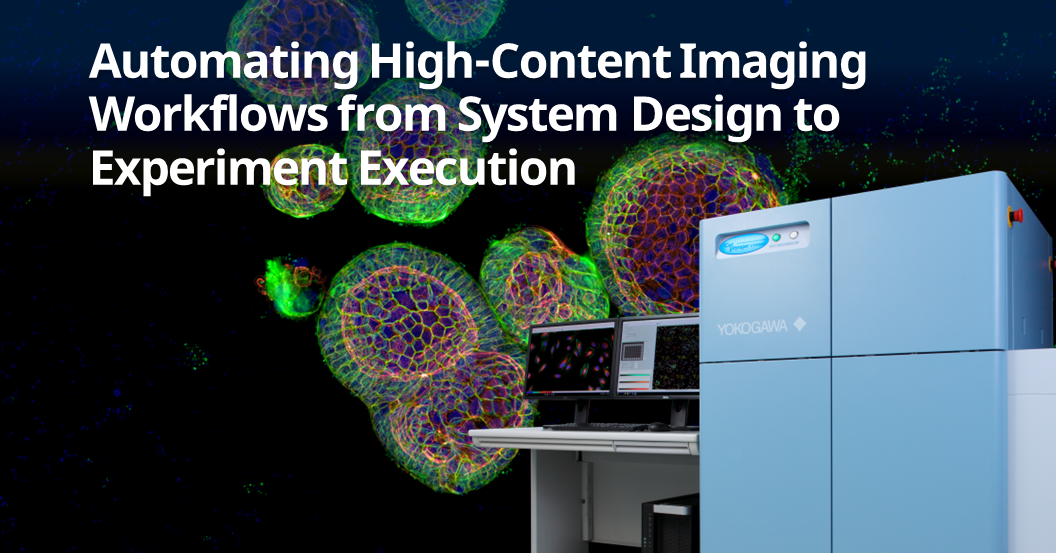
Total Solution - from Imaging to Analysis
Offering Total Solutions, from Measurement to Analysis Plate transport via robot, measurement using CellVoyager or CQ1, data management using CellLibrarian, and image analysis using CellPathfinder. We offer optimum combinations matched to users’ needs and budgets.

Large image: Click
Related products
 |
 |
|
 |
 |
|
※Data acquired in CellVoyager CV1000 are not supported.
※CellPathfinder system contains the software and the workstation.
System configuration
・Software
・Workstation
・Displays
Specifications of the workstation
Model: Dell Precision
CPU: Intel® Xeon
Memory:128 GB
HDD: System(C:) 4TB Storage, (D:) 4TB
OS: Windows® Microsoft Windows10 IoT Enterprise
GPU: System(C:) Quadro K620 or Quadro P620 (High-performance GPU is not selected.), Quadro RTX5000 (High-performance GPU is selected.)
Release Notes: 3.0.6
The new release of the software is modular. See the various optional functions for the other available modules.

Resources
PhenoVista Biosciences is the leading provider of custom, imaging-based, phenotypic assay services. With a collaborative and scientifically driven project design and management approach, PhenoVista has a proven track record of delivering high-quality data from robust and scalable assays. PhenoVista’s key advantage lies in the ability of their industry-trained scientists to combine world-class understanding of diverse biological systems with cutting-edge quantitative imaging to deliver clear, actionable output data.

Applications: Colony Formation, Scratch Wound, Cytotoxicity, Neurite Outgrowth, Co-culture Analysis, Cell Tracking

The primary goal of high-content imaging is to extract more data from biological samples, including, but not limited to, size, shape, number, and intensity. Here, we describe how the use of Yokogawa’s CQ1 high-content imaging system with microlens-enhanced dual Nipkow disk-based spinning disk confocal, combined with SUN bioscience’s Gri3D® microwell plates, synergize to propel organoid imaging to new heights. Learn more now!


Cell stage categorized using FucciTime lapse imaging of Fucci-added Hela cells was conducted over 48 hrs at 1 hr intervals. Gating was performed based on the mean intensities of 488 nm and 561 nm for each cell. They were categorized into four stages, and the cell count for each was calculated.


Fluorescent ubiquitination-based cell cycle indicator (Fucci) is a set of fluorescent probes which enables the visualization of cell cycle progression in living cells.


High-content screening is a crucial technique in drug development, utilized both in the initial phases for identifying new candidate compounds and in later phases for assessing the pharmacological effects and safety of these candidates. This report highlights three applications using Yokogawa’s CellVoyager CV8000 and CQ1 high-content screening systems, paired with Yokogawa’s CellPathfinder analysis software, creating an integrated and user-friendly platform for drug discovery.
Featured Assays
- Hepatotoxicity Assay: Evaluating the effect of vitamin K on HepG2 cells.
- Cell Migration Assay: Investigating the impact of mitomycin C on cell migration.
- In Vivo Tumor Metastasis: Studying tumor metastasis using zebrafish models.

In this tutorial, we will learn how to perform cell tracking with CellPathfinder through the analysis of test images.

In this tutorial, a method for analyzing ramified structure, using CellPathfinder, for the analysis of the vascular endothelial cell angiogenesis function will be explained.

In this tutorial, we will learn how to perform time-lapse analysis of objects with little movement using CellPathfinder, through calcium imaging of iPS cell-derived cardiomyocytes.

In this tutorial, we will observe the change in number and length of neurites due to nerve growth factor (NGF) stimulation in PC12 cells.

In this tutorial, image analysis of collapsing stress fibers will be performed, and concentration-dependence curves will be drawn for quantitative evaluation.

In this tutorial, we will identify the cell cycles G1-phase, G2/M-phase, etc. using the intranuclear DNA content.

In this tutorial, spheroid diameter and cell (nuclei) count within the spheroid will be analyzed.

In this tutorial, a method for analyzing ramified structure, using CellPathfinder, for the analysis of the vascular endothelial cell angiogenesis function will be explained.

In this tutorial, using images of zebrafish whose blood vessels are labeled with EGFP, tiling of the images and recognition of blood vessels within an arbitrary region will be explained.

In this tutorial, intranuclear and intracytoplasmic NFκB will be measured and their ratios calculated, and a dose-response curve will be created.
Downloads
Brochures
Videos

Yokogawa's CQ1 open platform integrates seamlessly with Advanced Solutions BioAssemblyBot® 400. With laboratory automation becoming a standard in research, Yokogawa's high content confocal system's ability to work with robots like Advanced Solutions' BioAssemblyBot® 400 is essential to advancing laboratory automation.


Generating translatable high-content imaging data from physiologically-relevant cell models, including 2D and 3D structures, is extremely valuable for drug discovery and pre-clinical research. In this webinar, James Evans, CEO of PhenoVista Biosciences presents case studies on how Yokogawa’s Benchtop CQ1 Confocal System can improve throughput and standardize processes for complex 3D cell-based phenotypic assays.
Key learning objectives:
- Strategies for designing and implementing high-content screening assays
- Approaches for deciding between 2D and 3D model systems
Are you looking to improve laboratory workflows, data management, and imaging analysis?
This webinar covers the integration of a high-content imager into a modern laboratory automation system and workflows built to utilize it. This on-demand webinar describes the integration topology used in the High Throughput Bioscience Center at St. Jude and the technical challenges that emerged pertaining to data handling and analysis. The webinar addresses the variety of ways we have used our high-content imager in the context of a high throughput screening center, using examples of experiment workflows from recent users.
Key Topics:
- Body Copy:
- Key considerations for integrating a high-content imager into a laboratory robot system
- Methods for interfacing between robots and the imager
- Important considerations for imaging data management and analysis
- How the St. Jude High Throughput Bioscience Center supports the diverse imaging needs of its projects

3D imaging experts from Yokogawa and Insphero have come together to provide helpful tips and tricks on acquiring the best 3D spheroid and organoid imaging. This webinar focuses on sample preparation, imaging, and analysis for both fixed and live cells in High Content Screening assays. The experts also discuss automated tools that can help researchers understand the large volume of data in these High Content Imaging Analysis Systems.

Physiologically relevant 3D cell models are being adopted for disease modeling, drug discovery and preclinical research due to their functional and architectural similarity to their tissue/sample of origin, especially for oncology research. Multifunctional profiling and assays using 3D cell models such as tumoroids tend to be manual and tedious. Further, high-content imaging of biomarkers in 3D cell models can be difficult.
In this two-part webinar present to you streamlined technologies which can bring consistent timesaving, ease-of-use, and high-quality data to your 3D cell-based workflows:
(A) The Pu·MA System is a microfluidics-based benchtop automated device for performing “hands-off” 3D cell-based assays. In this webinar, application scientist Dr. Katya Nikolov will present data from optimized assays using tumoroids followed by Yokogawa’s high-content imaging systems for biomarker detection.
(B) Yokogawa’s high-content imaging systems such as CellVoyager CQ1 provide superior confocal imaging using the Nipkow Spinning Disk Confocal Technology. Here, application scientist, Dan Collins will present details of the high-content imaging capabilities, easy to use and intuitive image acquisition software, especially for increasing productivity and a streamlined workflow.
Learn How:
- The open platform, Pu·MA System can be used to automate your 3D cell-based assays
- To perform automated IF staining for biomarkers using tumoroid models without perturbing your precious samples
- Image acquisition from 3D cell models using Yokogawa’s high-content imaging platforms
- Image analysis from cells, complex spheroids, colonies, or tissues using the CellPathfinder high content analysis software

Physiologically relevant 3D cell models are essential for drug discovery and preclinical research due to their functional and architectural similarity to solid tumors. One of the challenges faced by researchers is that many of the assays using these precious samples tend to be manual and tedious.
Using proprietary microfluidics technology, Protein Fluidics has created the Pu·MA System for automated complex 3D cell-based assays. In this webinar, application scientist Dr. Katya Nikolov will present her work on combining this novel automation technology with Yokogawa’s high-content imaging systems for biomarker detection in 3D cell models. Nikolov will demonstrate the utility of an automated immunofluorescence staining workflow followed by confocal imaging within the Pu·MA System flowchips. This automated workflow enables quantitative assessment of biomarkers which provides valuable data for further understanding disease mechanisms, preclinical drug efficacy studies, and in personalized medicine.
This webinar will explore:
- The Pu·MA System and novel technology for automated 3D cell-based assays
- How to perform automated immunofluorescence staining for biomarkers with a “hands-off” assay workflow
- How to visualize biomarkers after the assay with high-content imaging within the flowchip
Looking for more information on our people, technology and solutions?
Contact Us